Updated on June 5, 2026.
In 2025, the S&P 500 delivered a total return of 17.78%, while gold finished the year up 66.22% (New York University Stern School of Business).
Yet while gold has recently outperformed, the S&P 500 reached a new all-time high at the start of June—a reminder that short-term results often tell only part of the story.
Combined with gold’s historic rally last year, these developments have prompted many investors to revisit an enduring question:
How has gold actually compared to stocks over time?

Below, we present a data-driven comparison of gold and the S&P 500 across multiple decades.
By examining historical returns, volatility, and long-term performance, we’ll provide a clearer understanding of how each asset has behaved under different market conditions—and how making gold productive through yield changes gold’s long-term return profile.
Please note: All content is provided strictly for general informational and educational use. This information should not be interpreted as financial advice, nor should it replace professional consultation.
Has gold outperformed the S&P 500 in recent years?
Yes, it has. In fact, in the five-and-a-half decades since Nixon ended dollar convertibility into gold:
- Gold had superior returns in 24 out of 55 years, just shy of half the time.
- When gold outperformed the S&P, it did so by an average of 27.51%.
- In the eleven years that the S&P 5001 posted negative returns, gold outperformed in nine of them, averaging returns of 13.71% compared to -14.24% by the S&P.
(View the table containing this data.)
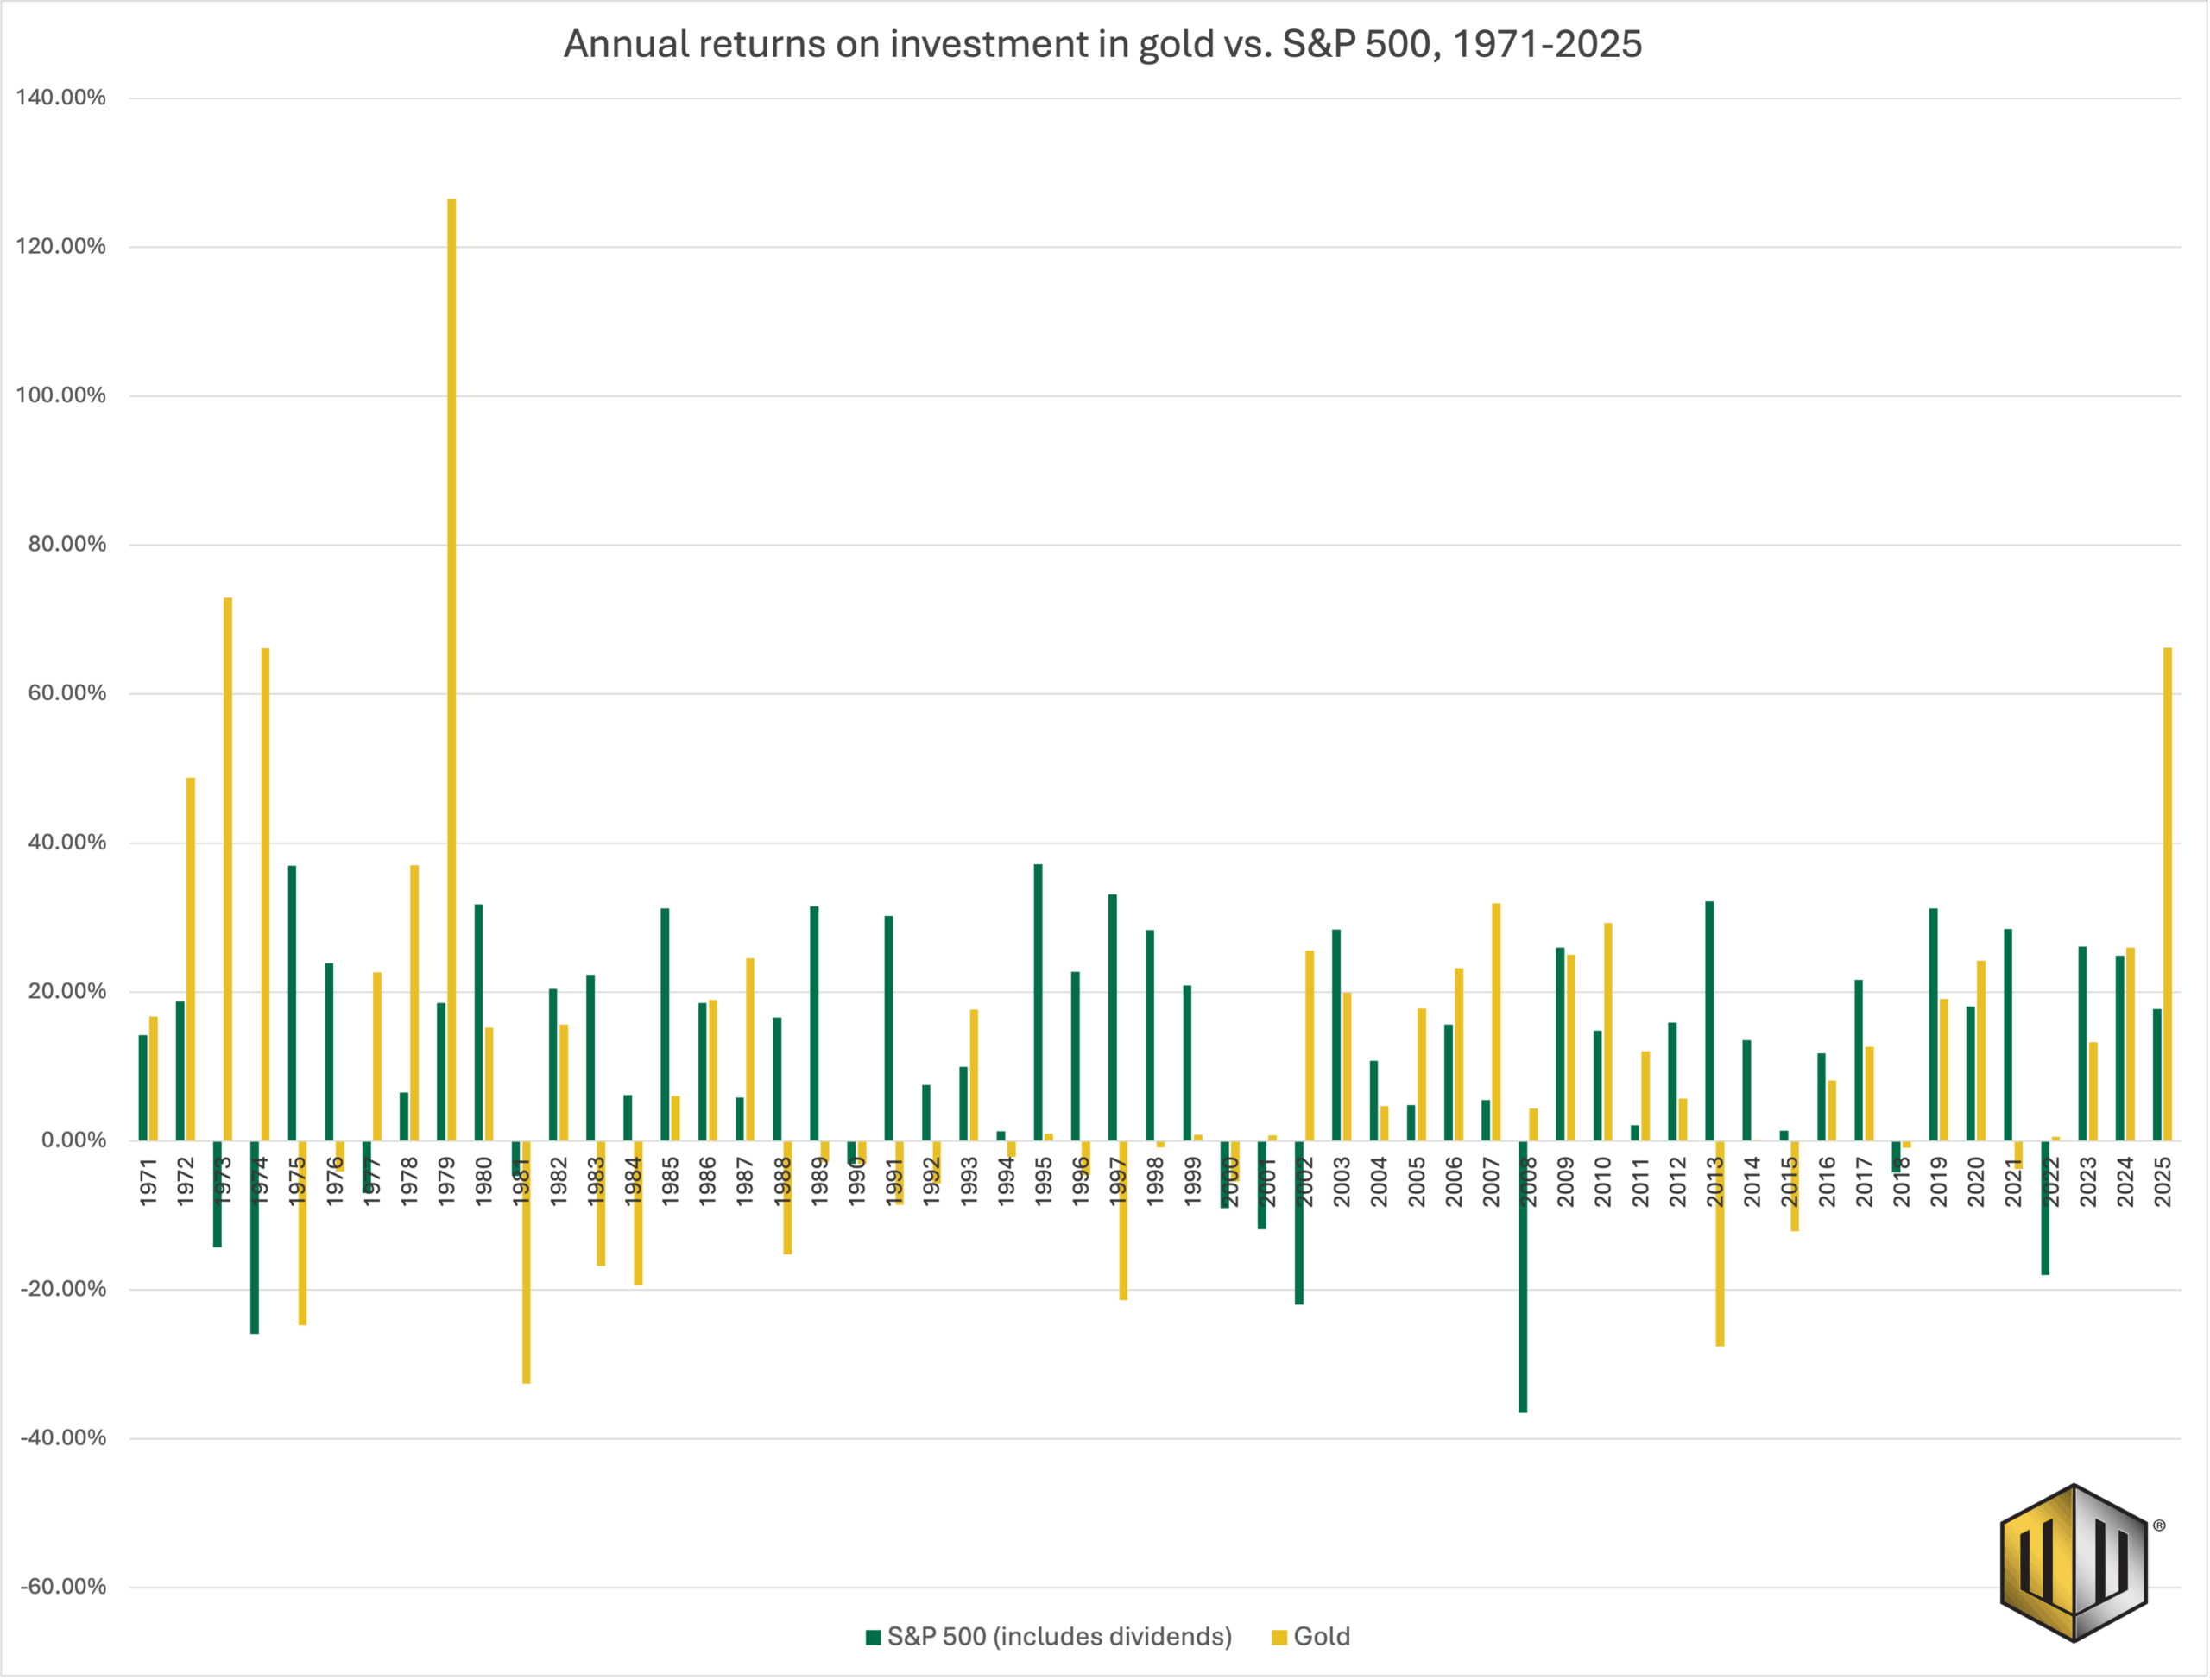
According to the historical data, gold’s performance was especially strong during periods of weak market performance, such as:
- the inflationary 1970s
- the dot-com boom and bust
- in the immediate aftermath of the Great Financial Crisis
Notably, the S&P 500 did show superior returns in 31 out of 55 years. Its strongest periods were during the 1980s, the high-growth 1990s, and throughout the 20-teens and 2020s. When the S&P 500 outperformed gold, it did so by an average of 22.57%.
So, while the S&P 500 outperformed gold more often, the data suggests that the metal has been a great asset for diversification. Historically, investing in gold has frequently produced strong results during periods when broader equity markets traded sideways or negative.
How do gold and the S&P 500 compare in returns and risk?
Comparing investment performance requires more than looking at which asset ended with the highest value. Returns matter, but so does the path taken to achieve them.
An asset that delivers strong long-term gains may also experience significant volatility along the way. Meanwhile, another may offer different performance characteristics during periods of market stress.
To compare gold and the S&P 500 fairly, we’ll examine three key metrics: long-term compounded returns, the growth of a hypothetical investment over time, and historical volatility.
Together, these measures provide a more complete picture of how each asset has rewarded investors—and the risks they assumed to earn those returns.
Compound Annual Growth Rates (CAGR)
The CAGR for both assets diverge substantially over the last 55 years:
- Gold’s CAGR = 8.15%
- S&P 500’s CAGR = 11.23%
- $100 invested in gold in 1971 would be worth $7,438.05 by the end of 2025.
- $100 invested in the S&P 500 for the same period would be worth $34,850.30.
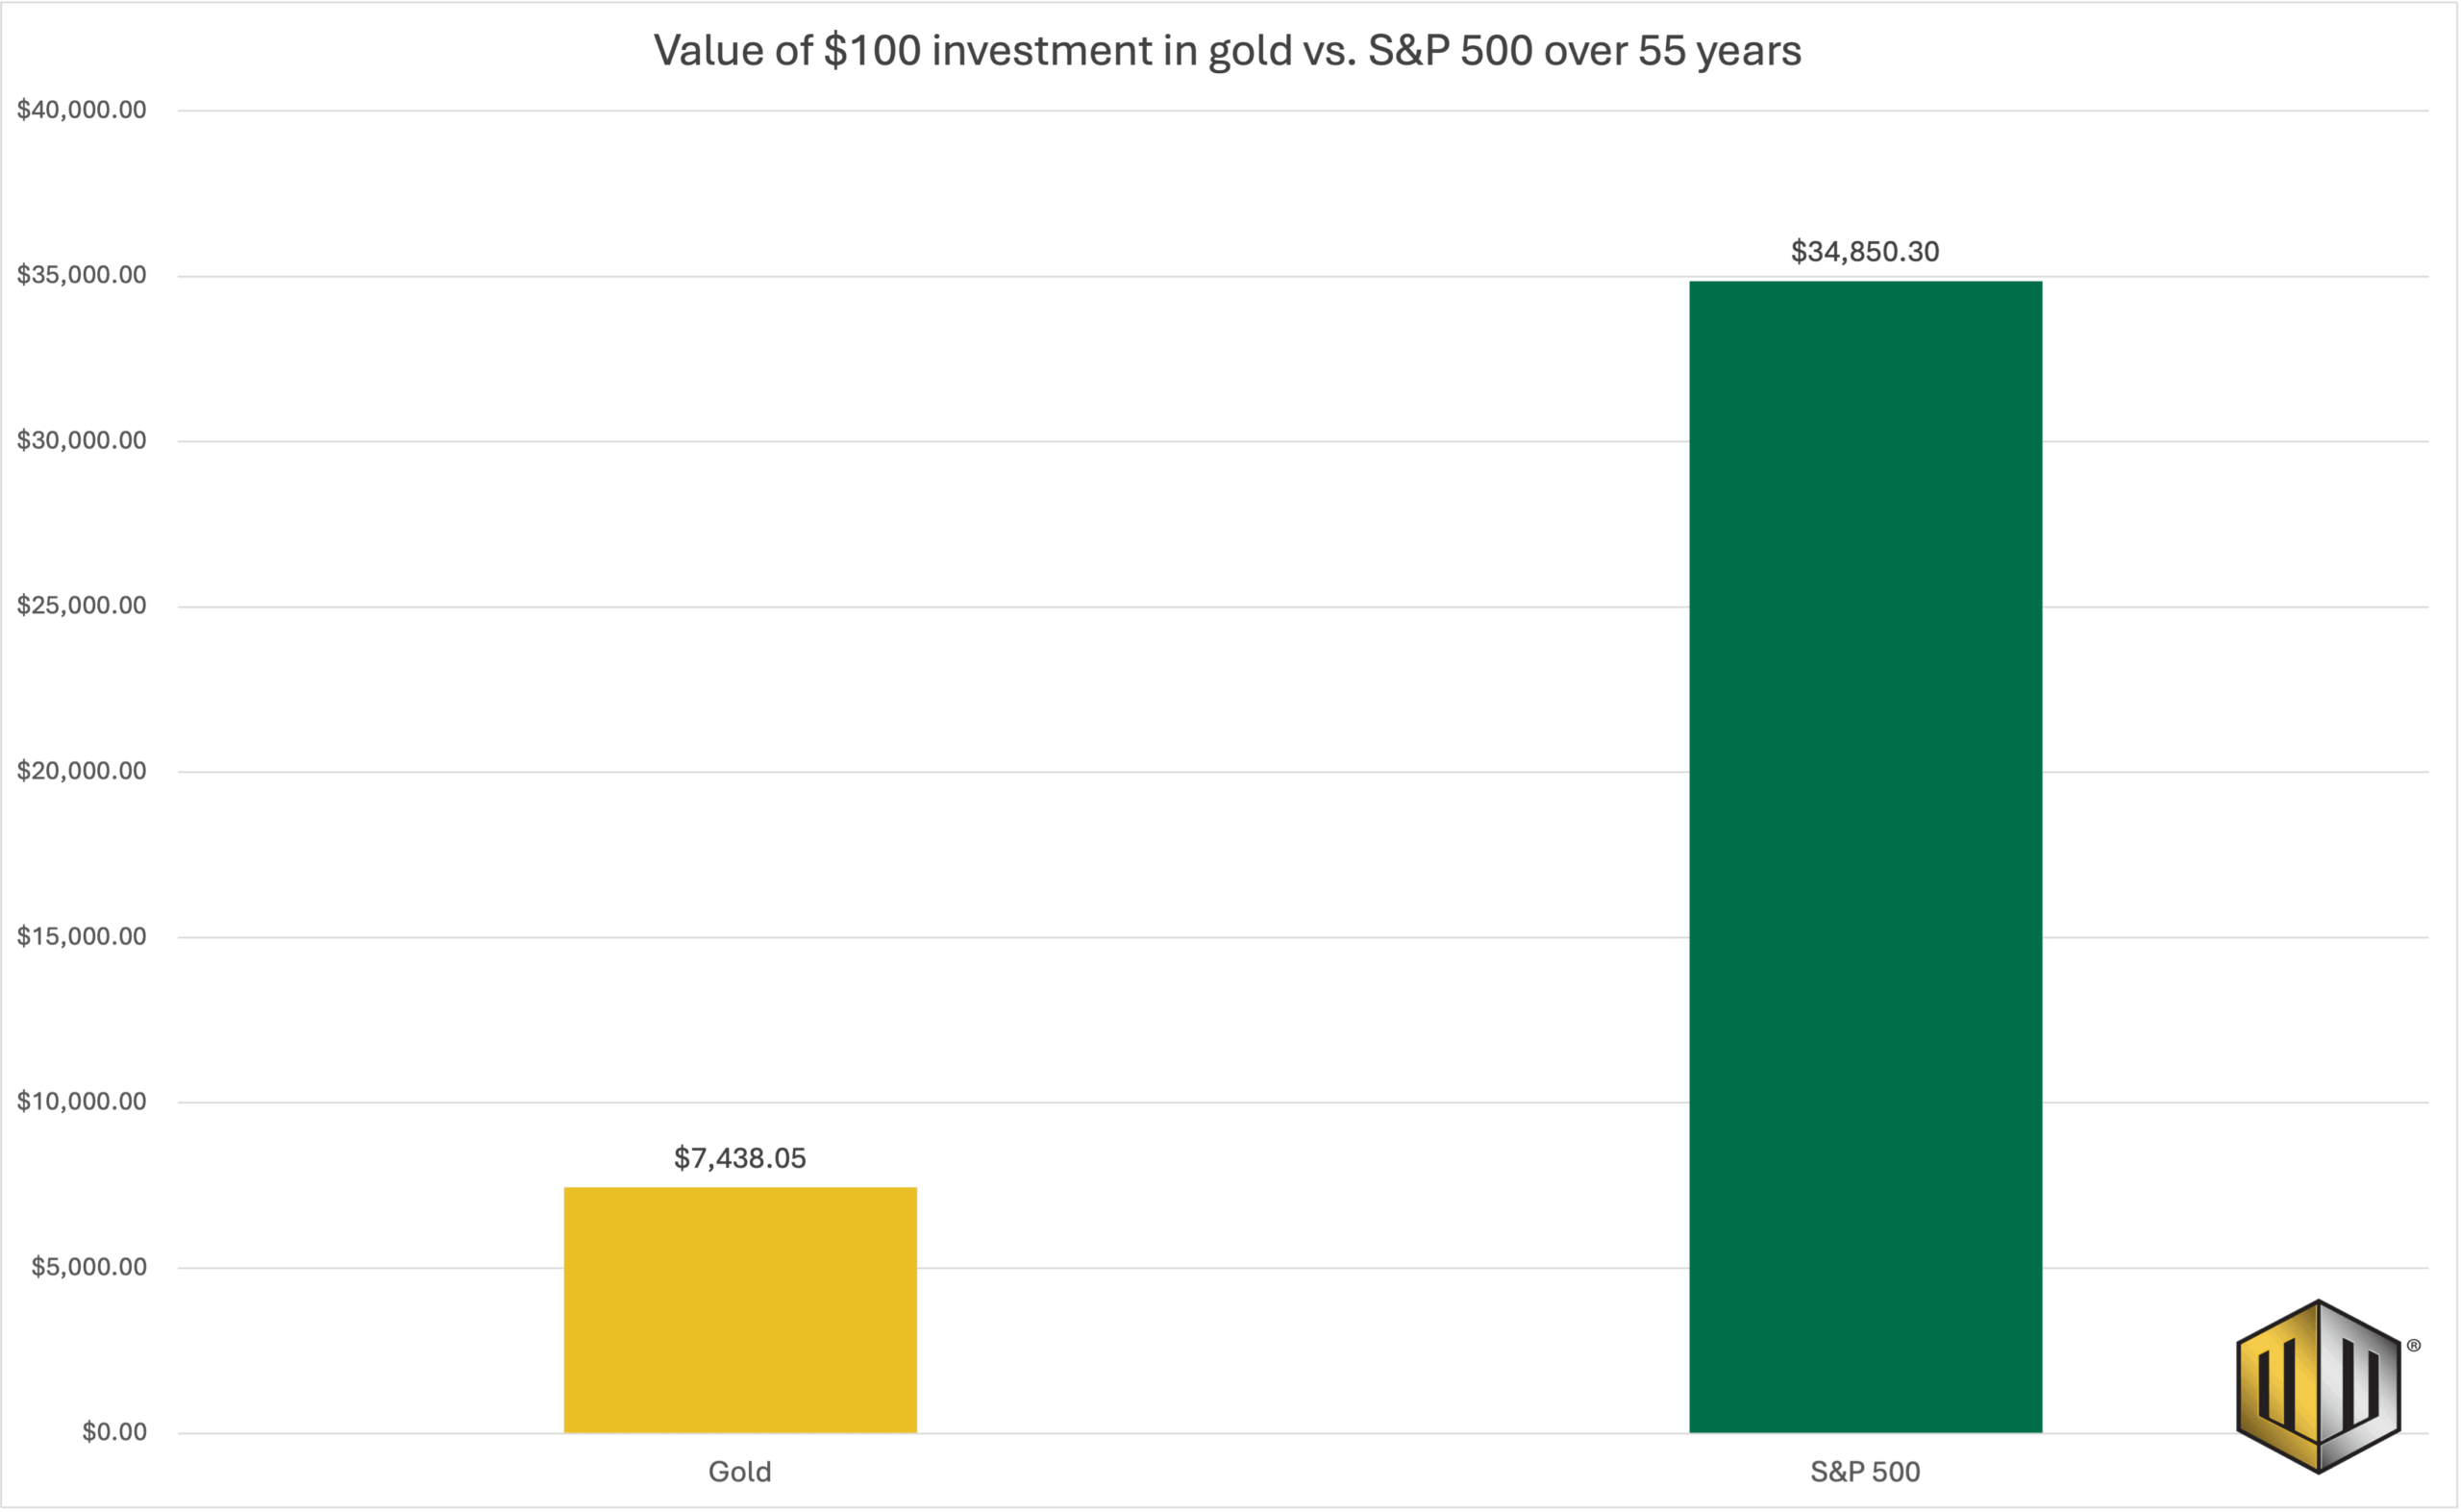
(But adding a yield to gold changes this picture substantially.)
Volatility as a proxy for risk.
Gold and the S&P 500 have both experienced meaningful volatility over the past several decades, but their risk profiles haven’t been identical. From 1971 through 2025, gold’s average volatility was about 10 points higher:
- Gold = 27.07%
- S&P 500 = 16.89%
However, since 2000, the gap has narrowed considerably, with both assets experiencing periods of elevated price swings during major economic and financial disruptions. Notably, the S&P 500 experienced severe volatility during events such as:
- the dot-com collapse
- the 2008 financial crisis
- the 2020 pandemic selloff
Gold’s volatility has tended to cluster around periods of inflation uncertainty, monetary instability, and sharp moves in interest-rate expectations.
(And today, adding yield can help to mitigate the long-term impact of volatility by steadily increasing total gold holdings over time.)
Even more fundamental, however, is the fact that gold historically doesn’t default or go to zero. The same can’t be said of the stocks that comprise the S&P 500.
This doesn’t mean there isn’t any risk holding gold, of course, but it’s important to consider the different risk profiles.
What happens if we add a 3.93% yield on gold to our portfolio?
So far, we’ve compared gold and the S&P 500 as they’ve historically existed: one asset that generates income and one that generally does not.
But what happens when gold becomes productive? At Monetary Metals, the weighted average return on gold in our leasing program is currently 3.93%.
Using this as a hypothetical annual gold yield (and assuming that all yield is reinvested), we can estimate how a productive gold investment would have performed over the same 55-year period.
- One ounce of gold cost $38.00 in January of 1971 (Macrotrends).
- With $100, you could have purchased 2.63 ounces.
- If you could have earned a 3.93% yield per year, you’d have 21.91 ounces by December of 2025 (the end of our 55-year review period).
- This changes the comparison drastically. By end of 2025:
- $100 invested in gold in 1971 would be worth $7,438.05.
- $100 invested in the S&P 500 in 1971 would be worth $34,850.30.
- $100 of gold purchased in 1971 and compounding at 3.93% annually would be worth $94,702.91.
- (Gold price = $4322.36 per ounce in December 2025 per Macrotrends).
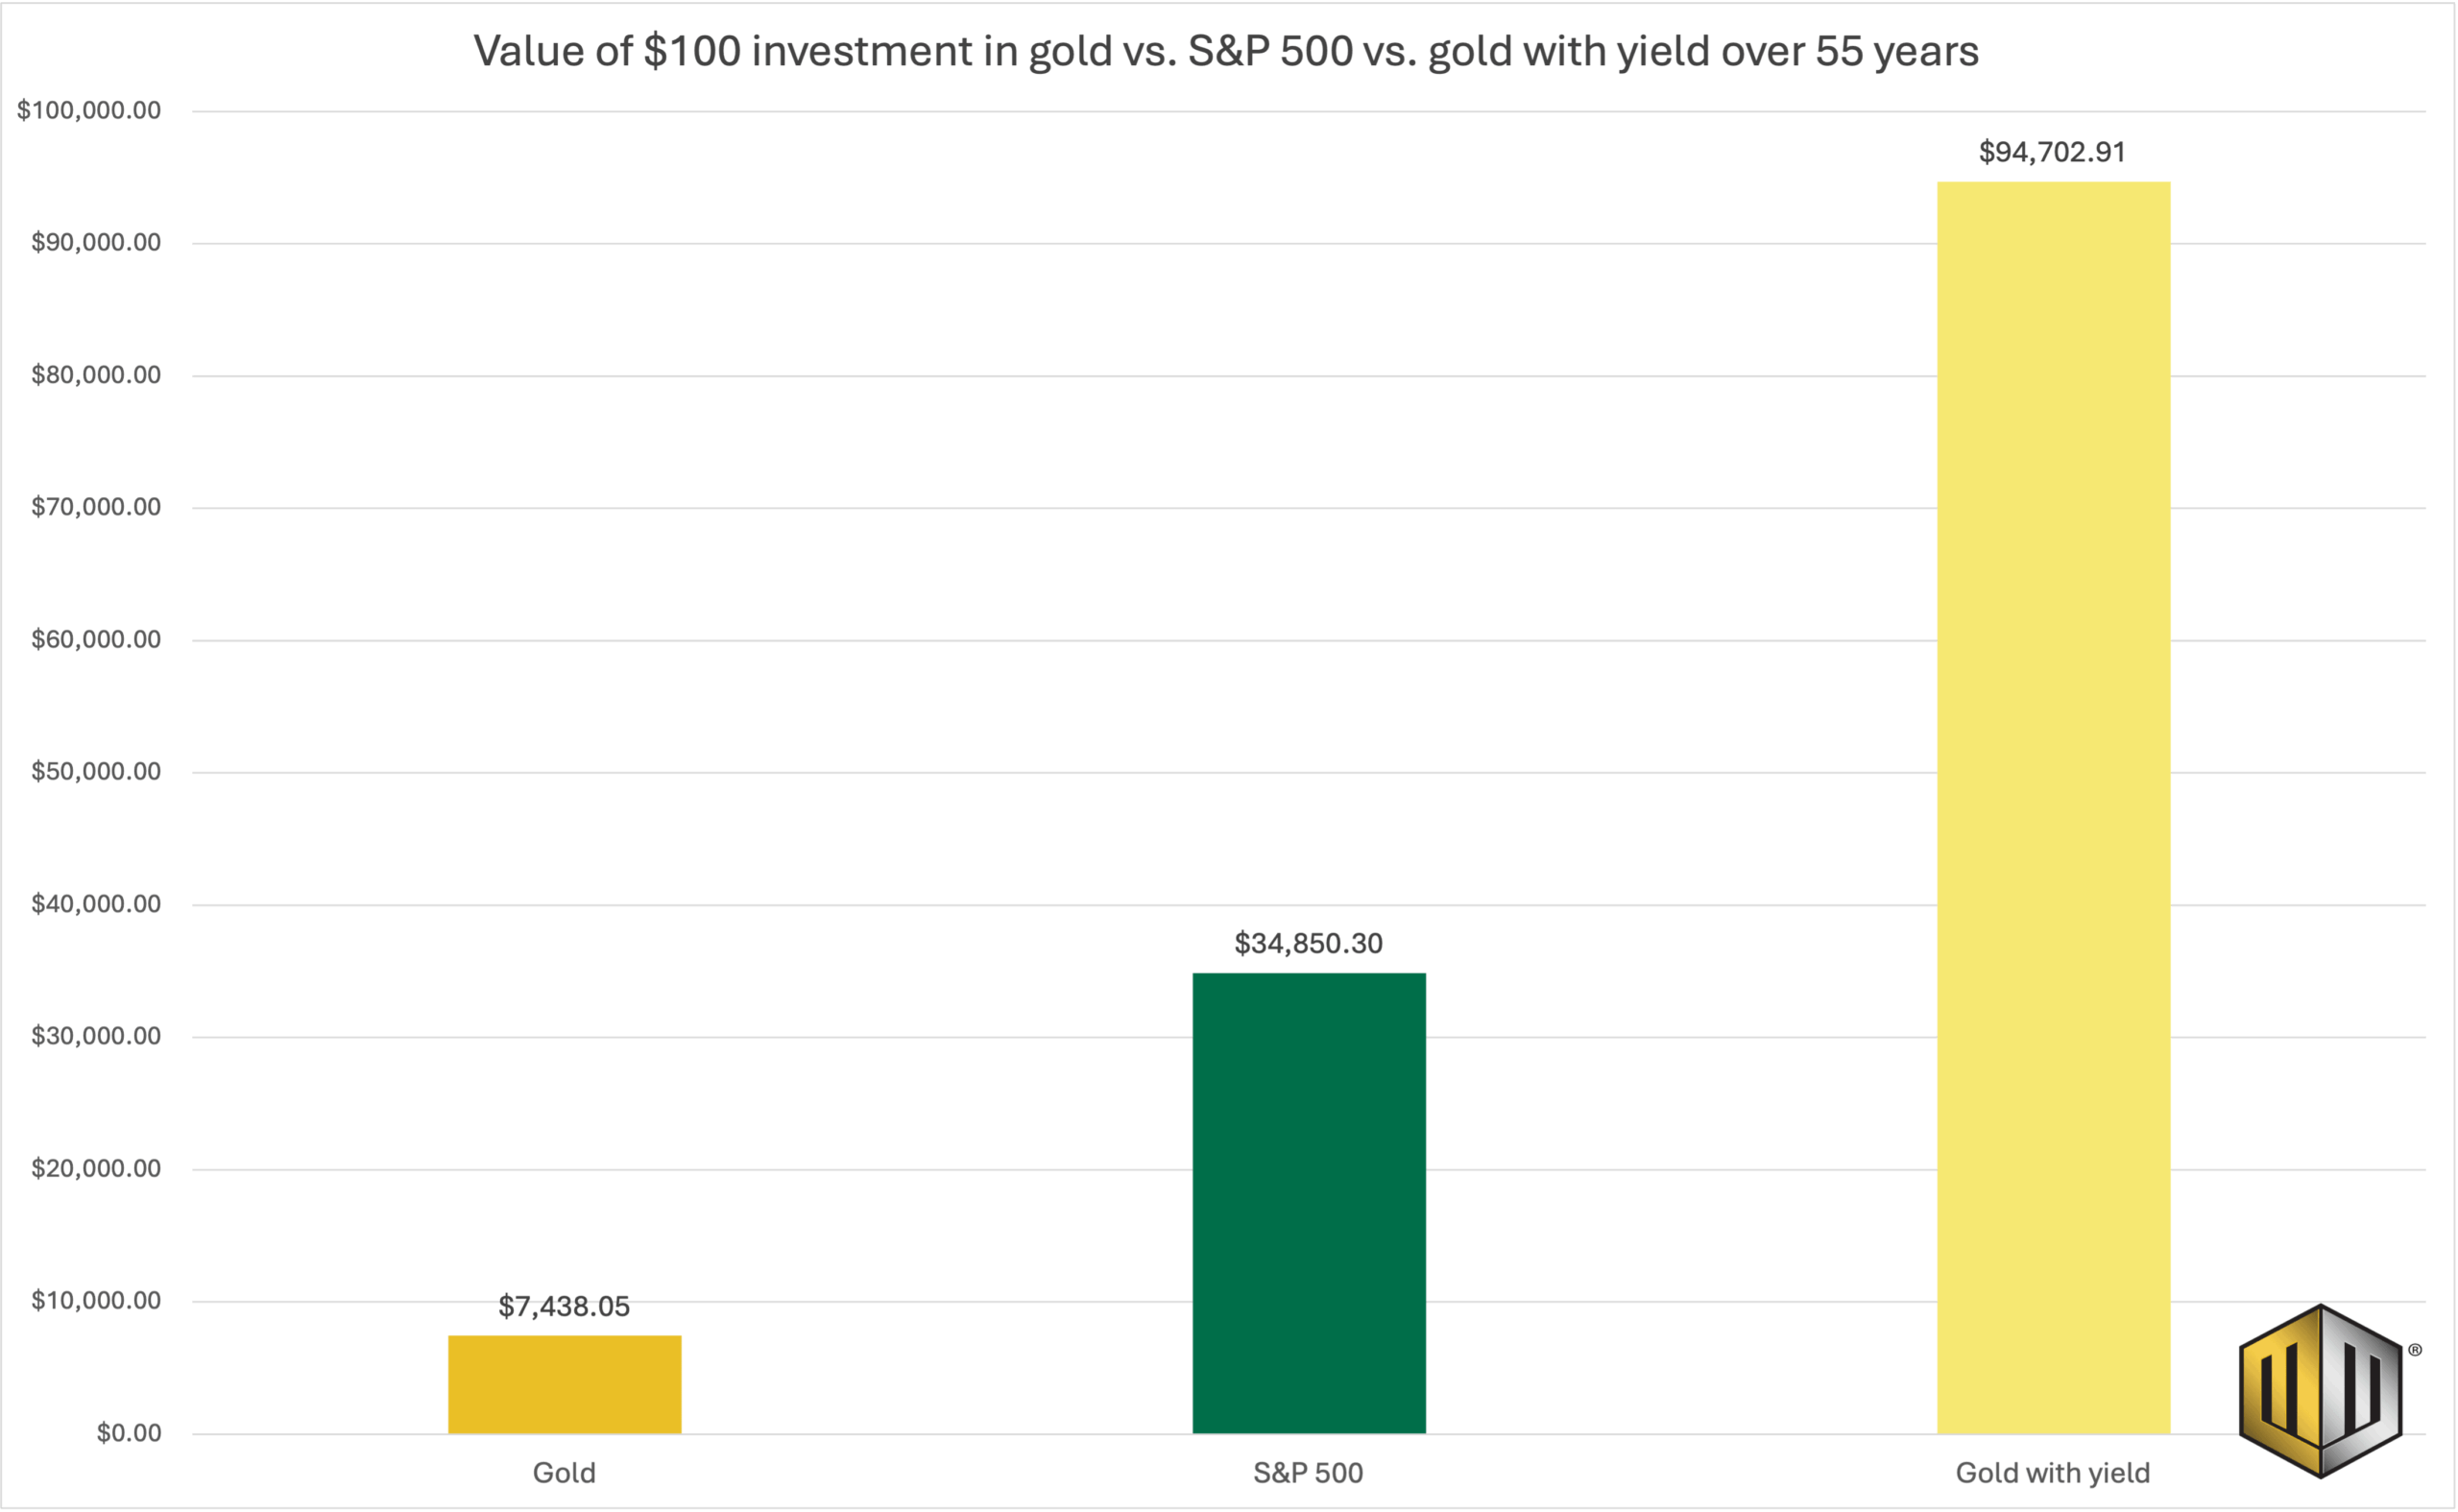
With yield, gold outperforms the S&P 500 in 29 out of 55 years—more than half the time— demonstrating why a yield on gold matters. And gold price volatility doesn’t materially change in this hypothetical scenario, since our model assumes a constant annual yield.
This analysis is important because two of gold’s main drawbacks are its negative carry costs and the fact that it doesn’t generate income on its own.
By earning a yield on gold, investors can overcome both.
“But people in 1971 couldn’t earn a yield on their gold!”
True, but people in 2026 can.
At Monetary Metals, we enable investors to lease or loan their gold to qualified businesses and earn an income paid in ounces in return.
Yields on gold leases pay between 3-4% in gold, and yields on gold bonds pay between 6-19% in gold.
Therefore, investors can supplement any price appreciation from gold with fixed income benefits as well.
Explore the potential of productive gold at Monetary Metals
Despite a sharp market selloff in March, gold remains resilient amid continued monetary uncertainty and central bank demand.
For investors seeking long-term resilience, adding yield to gold offers a distinctive combination of ounce accumulation, potential price appreciation, and income paid in gold itself.
Whether you’re looking to diversify beyond traditional financial assets, hedge against monetary uncertainty, or grow your holdings over time, gold with yield transforms a passive asset into a productive one.
Strengthen your portfolio—open your Monetary Metals account today!
1 Using total return data for S&P 500, including dividends.