For quite a while, we have been talking about scarcity in gold. The cobasis for both October and December is positive. These contracts are backwardated. The cobasis for the February 2016 contract is not far from backwardation. The gold market is tight. Why? Let’s explore.
Part of the matter is that the price has fallen. The more the price drops, the more buyers tend to come out, and sellers go away.
We do not refer necessarily to the mines. Once the capital is sunk, a mining company is a price-taker. Management has little choice but to extract what it can, and hope the quantity produced times the profit available at a given gold price is enough to pay the fixed expenses such as debt service (well, if they don’t have a proper hedging program, which I wrote about here and here). Gold is often produced as a byproduct when mining for other metals, and this production depends on the profitability of the main metal in the ore.
For thousands of years, the market has absorbed all the output from every mine. If the quantity theory of money were true, gold would be a worthless commodity. Unlike everything else (except silver), the stocks of gold held by the people are a large multiple of annual production. There is no such thing as a glut in gold.
The lower price is not the only factor. The price of silver has fallen more than the price of gold. However, while there is backwardation in the September silver contract, there’s nothing even close in December much less 2016.
We constantly emphasize that gold does not go up or down. It’s the dollar that goes down or up, respectively. It’s mostly down, from over 1500mg gold in 1913 to just under 28mg today. This is an epic fall of more than 98% (though it’s up from around 16.5mg in 2011).
If it is controversial to say that gold doesn’t move, it’s even more so to say that the cause of the dollar’s decline is not its increasing quantity. The cause is its decreasing quality. In just the last 44 years since President Nixon’s gold default, the dollar fell from about 780mg. It is no coincidence that this dramatic drop occurred while the dollar went through several upheavals. The dollar was a gold redeemable currency, and then it was just a slice of the US government’s debt. Then the government spent more and more on less and less. After 2008, the dollar is partially a slice of mortgage debt, of unknown provenance.
It bloody well should be worth less! It represents less, claims less capital, and its likely repayment is dropping like a lead balloon.
That only leaves the question of why it has been rising for four years.
We think it boils down to confidence. Virtually everyone, from the blind faithful followers of the Fed, to its harshest critics, accept that the dollar is money. In other words, they are confident in the greatest confidence scheme ever.
In their view, gold goes up and down. This means: buy gold when it’s going up. And stay away, or even short it, when it’s going down. They have charts to tell them when this is occurring. And the fact is that gold has been going down for years. Few want to own a falling asset.
We use the metaphor of a Ouija Board frequently in discussing the gold market, or any market in which speculation is rampant. Everyone has a thumb on this little plastic piece, and it slides all over the board as if by magic. Well, it’s not magic. It’s just going wherever the mood of the group takes it.
The price of the dollar—of which the price of gold is just the inverse—goes here and there based on the mood of the crowd. Bigger crowd, same phenomenon.
Right now, the mainstream speculators who use futures see little reason to worry about the credit of the counterparties of their dollar deposits. Stocks and real estate (especially the kind of real estate favored by those who can buy or sell gold futures) are going up.
They also see little reason to buy gold as a hedge to inflation. If prices aren’t rising—and just ask the shale oil producers about the price of crude oil—then there’s doubly no reason to buy gold. At least, in the mainstream view.
At the same time that mainstream speculators don’t see it, those who are closer to these powder kegs do see something. Someone is buying gold metal, in preference to gold futures. Perhaps they see the coming trainwreck in $550B in shale oil junk bonds. Perhaps they see Spain going Greek. Perhaps they see wholesale bankruptcies coming in China. They are either buying gold metal, or at least not selling it.
The basis and cobasis are extraordinarily sensitive metrics. There isn’t a wholesale divorce between paper gold and phyz. The spread for the December contract is currently one third of one percent annualized. Still, it shows a sentiment disparity between speculators and stackers—the rest of humanity—who own the metal itself.
We have a bizarre environment. The speculators’ favorite assets are relentlessly rising. At the same time, the quality of credit is falling across many sectors and geographies. So long as the stock market holds, then credit doesn’t matter to the speculator. However, when a wave of credit defaults occurs, it will suck the liquidity out of the markets, cause spending and hence revenues to drop, and reverse the direction of both stocks and the dollar.
We should emphasize that we are making educated guesses about confidence and speculator sentiment. We are filling in some blanks. It’s possible that the above is not 100% right. However, we are certain of four things.
One, the bid price on gold metal is higher than the ask price on gold futures. Two, this should not be able to occur, and that it does means the market is tight. Three, there is an ever-changing dynamic between hoarders, speculators, arbitragers, producers, and manufacturers. Four, the market price of gold is below the fundamental price (i.e. the dollar is overpriced).
…
This week, the prices of the metals rose, $21 and $0.41 respectively.
Read on for the only accurate picture of the supply and demand conditions in the gold and silver markets, based on the basis and cobasis.
First, here is the graph of the metals’ prices.
The Prices of Gold and Silver

We are interested in the changing equilibrium created when some market participants are accumulating hoards and others are dishoarding. Of course, what makes it exciting is that speculators can (temporarily) exaggerate or fight against the trend. The speculators are often acting on rumors, technical analysis, or partial data about flows into or out of one corner of the market. That kind of information can’t tell them whether the globe, on net, is hoarding or dishoarding.
One could point out that gold does not, on net, go into or out of anything. Yes, that is true. But it can come out of hoards and into carry trades. That is what we study. The gold basis tells us about this dynamic.
Conventional techniques for analyzing supply and demand are inapplicable to gold and silver, because the monetary metals have such high inventories. In normal commodities, inventories divided by annual production (stocks to flows) can be measured in months. The world just does not keep much inventory in wheat or oil.
With gold and silver, stocks to flows is measured in decades. Every ounce of those massive stockpiles is potential supply. Everyone on the planet is potential demand. At the right price, and under the right conditions. Looking at incremental changes in mine output or electronic manufacturing is not helpful to predict the future prices of the metals. For an introduction and guide to our concepts and theory, click here.
Next, this is a graph of the gold price measured in silver, otherwise known as the gold to silver ratio. The ratio moved down this week. It had been quite a bit lower, but moved up sharply on Friday.
The Ratio of the Gold Price to the Silver Price

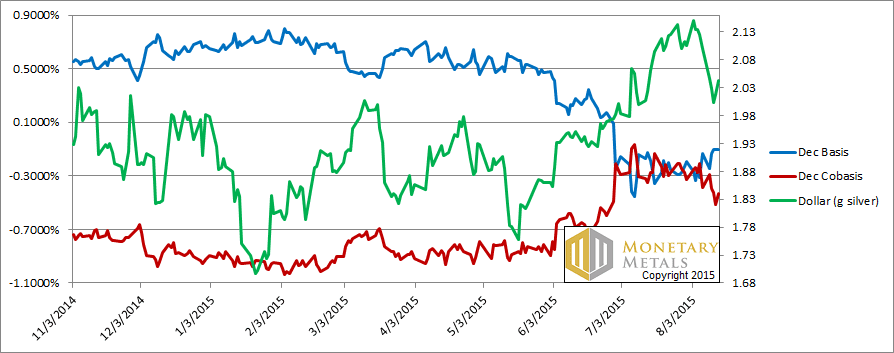
For each metal, we will look at a graph of the basis and cobasis overlaid with the price of the dollar in terms of the respective metal. It will make it easier to provide brief commentary. The dollar will be represented in green, the basis in blue and cobasis in red.
Here is the gold graph.
The Gold Basis and Cobasis and the Dollar Price

The price of the dollar dropped (i.e. the price of gold rose). However, the cobasis ended a hair higher than it was last week.
Let’s look at a new type of chart. It fits with our major themes: (A) the value of gold does not change, and indeed value is measured in gold the way length is measured in meters, (B) the market price of the dollar, which is just the inverse the commonly quoted price of gold, does move, and (C) the fundamental price of gold, which is just the inverse of the value of the dollar, moves independently of the market price.
We would love your feedback on this graph. It does not show price at all, but the discount (green) or premium (red, not shown as this has not occurred in gold in recent months) available on gold in the market.
A higher value, depicted as a deeper green, shows that gold is being sold at a larger discount to its value (i.e. the market will buy dollars at a premium). A value below zero indicates gold is selling at a premium.
The goal should be to accumulate gold at a discount, but avoid it when it’s trading at a premium (we always emphasize that one should NEVER NAKED SHORT A MONETARY METAL! You never know what some mad central banker will do while you are sleeping, and you could wake up to a 5% or 10% spike).
The Gold Discount

Now let’s look at silver.
The Silver Basis and Cobasis and the Dollar Price
The price of silver went up. However, unlike in gold, the cobasis (i.e. scarcity) fell.
The Silver Discount

The silver discount chart looks radically different than the one for gold. There’s little bargain to be had—yes even at today’s price.
Silver is not only more volatile in its price, but also in its supply and demand fundamentals. Buyers came out for silver metal in the first few weeks of July, but then withdrew again. Now, with the rising price, it’s just a rising premium.
Gold measures the value of all things including the dollar and including silver. By contrast, the value of silver does go up and down. Not only are there speculators, but there are also industrial users. Not all silver that’s used in manufacturing is recycled. Therefore, a manufacturing downturn can press the value (and price) of silver.
Please drop us an email or comment, and let us know what you think of this new type of chart. Thank you! :)
Monetary Metals will be in New York City on Friday afternoon, September 11. You are cordially invited to join us for a discussion of the dollar, the interest rate, gold, and investing. Midtown. RSVP here.
© 2015 Monetary Metals


Just trying to walk through an understanding of the gold discount chart:
A – The value of gold does not change.
Ok, elemental gold is elemental gold. It has a fixed value, with the quantity being determined by its weight.
B – The market price of the dollar, which is just the inverse the commonly quoted price of gold, does move.
Easy enough, you have the dollar in milligrams of gold, or (1 / market price) * 31.1034768 * 1000
Point C gets confusing
C – The fundamental price of gold, which is just the inverse of the value of the dollar, moves independently of the market price.
What is the value of the dollar? Obviously it is not the same as the “market price” in milligrams of gold or else the fundamental gold price and commonly quoted market gold price would match up the same every time.
Right now on the chart it says gold is at a “~10% discount” to market price. So spot gold is $1117.89 right now (dollar is 27.82mg gold), that means the “fundamental” price of gold is $1,242.10 (1,117.89/0.9), and 25.04mg of gold for the dollar.
This implies the market price of the dollar is trading at a 11.1% premium to its “value”.
It all sounds interesting but it’s just working backwards from an arbitrary value on a chart with no explanation as to how the initial data was calculated in the first place. If this is a “proprietary secret” then the audience really can’t truly understand what they are looking at and the whole thing drifts more towards “fortune telling” for anyone lacking knowledge of the “fundamental price” calculation.
Given the fortune telling nature of the chart to the audience, you may want to overlay either the dollar price of gold, or dollar price (in mg of gold) on the right axis and extend the date range of the data as far as possible. Then we can see if this data has historically had any fortune telling properties of prices or if it is just a collection of historical prices with no correlation or relationship.
“[I]t’s just working backwards from an arbitrary value on a chart with no explanation as to how the initial data was calculated in the first place.” I half-agree with this critique; Keith has been talking about fundamental value in a way that almost suggests the Aquinas/Aristotle idea of “intrinsic value”, and has been coy about whatever formula he’s been using to calculate it. I suspect that he is protecting a proprietary formula, and if so, more power to him.
But I think Keith has documented what he sees as fundamental for gold. It is a metal which should stay in contango and pay the warehouse a carrying charge commensurate with the costs of keeping a gold hoard. The current reading of ~10% discount indicates the speculative return (in gold) that you might expect from holding gold until that “normal” environment is reestablished.
In backwardation, you are not being paid an income to carry gold; you’re offered a good lease rate to de-carry it. Fundamental value may be trying to price-in the eventual regression to the mean. That makes it a (proprietary) function of the red and green lines in Keith’s charts of particular futures contracts. I think I’d find this interesting to track, especially if it smooths out the discontinuous nature of discrete contract months. Of course if the formula remains a mystery for too long (i.e. stays irreproducible), its importance intellectually will be diminished. For now, I’m content to let the inventor tease us with the hope of a fabulous leading indicator.
Excellent review yes these charts give any interesting perspective add them each week. Obviously the midnight bomber going most likely naked short Gold futures hasn’t read your warning but is aware their shorts are in need of protection, someone is going to be caught naked if this 10% discount remains. It does look like a stalemate someone with a large short position wants to get long but can’t off load them this is getting interesting.
Hi Keith, I like the new chart. Can you also include an updated multi-year cobasis & basis chart? Thanks, Jeff.
Hi Keith, I always enjoy reading your reports and I like the new chart.
I too like the chart and second the request for a longer term perspective (I recall discounts being similar a couple of years ago when the gold price was 200-300/oz higher). So what happens to supply/scarcity with a rebound back towards $1200? Seems to me the last drops of blood (gold bugs’ blood) are being squeezed from the stone. Front-running in the futures market followed by physical supply on the rebound, perhaps by the same people. Pater Tenebrarum, for example, has described the large long speculative position taken at the very beginning of the bull market, which was liquidated in 2013.
Like the new charts.
Am I right in reading them as “green is a good time to accumulate,” if that’s what you’re doing?
I’d be interested in your thoughts on not just how far, but how long, the metals can stray from their fundamental price. Seems like it can be a long while.
When you said last week that the fundamental price is $100 bucks above the current price–how is that arrived at–past history of premiums and discounts? A black box? I agree with the first commenter, Pizza Genie. Without knowing how the fundamental price is arrived at, then we don’t know precisely what the premiums and discounts signify. Today, you are saying that the bid price is stronger than the offer? Why is the fundamental price $100 higher rather than $50 or $1000?
Bid price on spot is higher than offer or sell on futures/paper. The first one is the current, today’s price, the second is the future price. That is backwardation when you have a future price of gold that is lower than the current price.
Keith, I like the new chart. It is a visualization of the magnitude difference between your fundamental price and market price. Can you add weekly markers to your other graphs?
On the rising value of the dollar, debt-backed, fiat currency in its mortality phase turns everything upside down economically as it desperately struggles to survive. One effect of that struggle is that all debt is denominated in the fiat currency. As defaults spiral, they destroy ever increasing quantities of the currency. Thus, we have the phenomenon that the quantity of currency is declining simultaneously with its quality.
In this context, confidence in the currency begins taking its blows. However, with current levels of world-wide debt, there are few individuals or entities that are debt free. Therefore, the demand for that currency increases even as quality and confidence decline as people and entities struggle to remain solvent. Another consequence of the mass attempt to remain solvent is the selling of any real asset, voluntarily or involuntarily, to generate currency to repay debt.
The breaking point will be when indebted individuals and entities, with any remaining assets, recognize what the final outcome will be and stop prioritizing debt repayment and prioritize hoarding — gold, silver, non-perishable food, etc. — as those items will mean the difference between surviving and not. That is point when confidence breaks and gold/silver are in permanent backwardation.
It should be obvious that we (collective social mood) are quite a distance from that point, mentally & emotionally. Temporally, it is difficult to judge how long this will take — at least many months, probably a few years minimum. But, diligence is necessary.
Keith the whole point of the SDR is to replace gold as the global reserve asset. Clearly this is the direction the international bankers are moving in. If you believe market confidence will collapse into gold, then I will assume you think the SDR scheme will not work despite all of the careful planning over the last 40 years. Why do you think the SDR scheme will not work? Thanks.
Keith,
I really like the spiffy new chart, and even color-coded too, for a righteous smidge of drive the point home drama.
A really good article too, and my favorite significant point was the one you made about the dollar being just slice of the US government’s debt, and its likely repayment is dropping like a lead balloon!
Thanks for the great work and info!
Hello Keith,
Just found your site a few days ago. I think it was from a Silver Doctors article you posted. Since then I have been reading to understand your’s and Dr. Fekete’s ideas about gold as money. I’ve been especially interested in your concepts about gold’s unique supply and demand characteristics that would enable one to trade it, instead of just passively stacking it.
About the new chart: you requested feedback. I have to agree with Pizza Genie concerning point (C). Unless a reader can independently distinguish the “value” of a dollar from the “price” of a dollar, the chart does not have enough credibility for me to use as a basis for trading decisions.
Thank you for all of the insightful work you have done here. I really appreciate it and I’m sure many others feel the same.