Last week, we discussed Social Security, a Ponzi scheme that is inevitably approaching its default. That leads us to another point in our broader discussion of capital destruction. Let’s illustrate with an example.
The Fraudulent Promise
Suppose Eric works for wages. He is 50 years old. His house is paid off, he has no student loans, and owns his car outright. He has no debt (he is a rare type of person). His kids are out of college. He has no expenses except ordinary living costs, and no demands on his savings except his own retirement.
Oh, and one other thing. He gets a statement from Social Security telling him that they will pay him a pension when he retires in 17 years.
When faced with a choice to take a vacation or save for retirement, he wonders why he should deny himself a bit of pleasure. With retirement covered by Social Security, there’s no need to save for retirement. So each year, he visits a place on his “bucket list”, not worrying about how he will live when he is in his 70’s and 80’s.
You see the problem. Social Security cannot go on paying as it has promised to pay. Eric will not have the secure retirement that he plans to have. In future years, he will look back bitterly on the bogus account statements they sent to him. He will play over and over in his mind what he spent, thinking he should have saved more. His spending was based on a counterfeit promise, a fraud.
Capital Consumption
This is another way that the system drives people to consume their capital. Social Security may or may not be considered a debt, either legally or for accounting purposes. We will leave that debate to others. However, people certainly count their future Social Security checks as an asset. In order for that asset to be good, there must be a corresponding liability somewhere, and the party with that liability must have the means and intent to make good on their promise.
Eric is spending his income, in the belief that he has an asset that will cover him in retirement. But the asset is a fraud. It does not exist. It is merely the dishonorable promise of a Ponzi scheme.
He believes there is accumulated capital, in his name, waiting for him to retire. As we explained last week, the government consumed that capital and replaced it with a counterfeit promise to pay. But at least, for Eric’s sake, that bond has a robust market value. The bond can never be redeemed, but at least it can be sold. The borrower will never return the capital borrowed plus interest, but at least someone else will fork over his capital to buy the bond.
And now Social Security has reached the point where it must start selling these bonds in order to keep the checks flowing to current retirees. Social Security will be forced to sell at a faster and faster rate, until it has depleted its fund.
The Wealth Effect
We have just described the so called wealth effect. Savings including assets can be converted into income by selling an asset, just as income can be converted into savings by buying an asset. If the value of one’s assets rises, it is equivalent to having earned the money and bought more assets.
The so called wealth effect is the dirty little secret behind central bank attempts to juice up GDP. Central banks don’t gift people with money, to directly spend. They buy assets, which pushes up asset prices. Everyone gets a wealth effect from this.
But even an 8th grader knows that a central bank cannot print wealth. Yet everyone with stocks, bonds, real estate, or even antique Ferraris looks at his brokerage statement and appraisals and believes he is wealthier.
This is one of the great contradictions of our era. People see numbers in black and white that tell them something has happened, which if they think about it intellectually, they know in the abstract is not true. Cannot be true. Our point today is that they spend as if it’s true.
Socialism: The System of Institutionalized Capital Destruction
One way to define socialism is the system that seeks out all forms of capital, for consumption. Declaring “to each according to his need,” does not just take your income. It takes your accumulated capital, too. Socialism does not do this only by means of totalitarian dictators and armies of thugs in the streets. In the more enlightened West, we don’t have a high tolerance for a Stalin, a Kim, or a Castro. There are other ways.
We just looked at two of them. One is that the central bank does not print wealth, but it causes a wealth effect. Meanwhile the economics profession indoctrinates generations of young minds with twin ideas. First, that GDP is the measure of the economy. Second, that higher GDP means growth, and growth is good. The wealth effect is one way to manipulate people to consume their capital, to spend, and thereby get GDP up.
Two, the government makes promises to provide income in the future. Feeling secure about their retirement, people are free to spend the capital they should be saving. But hey, GDP is higher.
No matter the mechanism, whether Nicolás Maduro takes over the factories and farms in Venezuela and jails the owners, whether the Fed pushes up asset prices, or whether Social Security falsely tells people that it will pay them a pension, the result is the same. The seed corn is eaten. The furniture is burned for firewood. The capital is consumed. In the end, people will regret it.
We will be talking a lot more about gold bonds. One of the virtues of the gold bond is that it makes it much harder for the socialists to get people to consume their capital. It’s not a magic talisman of protection. It does not guarantee good behavior. It simply provides the right incentives.
Supply and Demand Fundamentals
A few weeks ago we said:
This is not an environment for a Lift Off Event.
Sure enough, this week the price of gold was down $9 and that of silver down 11 cents. And now we are just one week away from the latest magic date put forth by a celebrity gold hawker, for when the dollar is going to hit its ignominious end!
OK, all joking aside, our monetary system has many serious problems. But none of them have a planned date like this. That’s not how it works.
So whither the price of gold? We will provide a picture of the changing gold and silver fundamentals. But first, here is the chart of the prices of gold and silver.

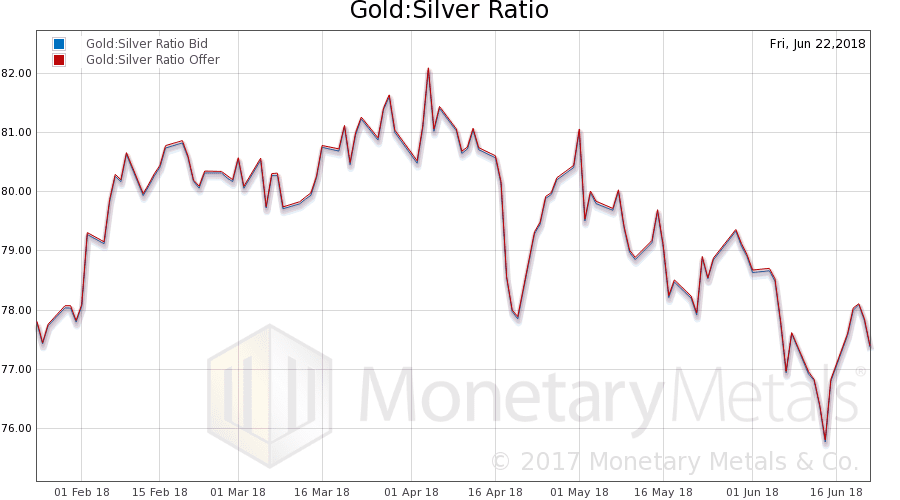
Next, this is a graph of the gold price measured in silver, otherwise known as the gold to silver ratio (see here for an explanation of bid and offer prices for the ratio). It was unchanged this week.
Here is the gold graph showing gold basis, cobasis and the price of the dollar in terms of gold price.
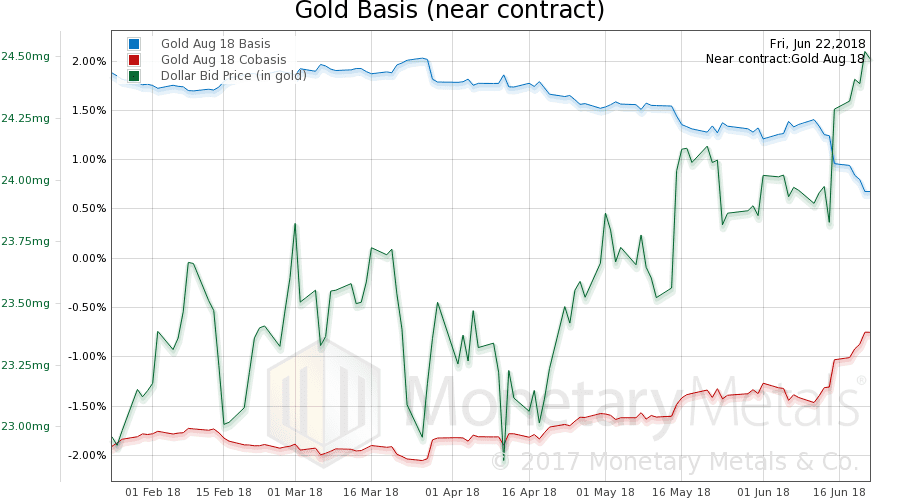
Something stands out, practically jumping off the page. The price of the dollar jumped 0.7mg gold (i.e. the price of gold fell $33) from June 14 through Friday. Gold became a little scarcer, but not a lot. The not-a-lot increase in the cobasis is clearer when you look at the Gold Basis Continuous Chart.
The Monetary Metals Gold Fundamental Price fell another $10 this week to $1,324. The fundamental has now completed its round trip, first up out of the range it’s held since Q2 2017, and now back into that range.
Now let’s look at silver.
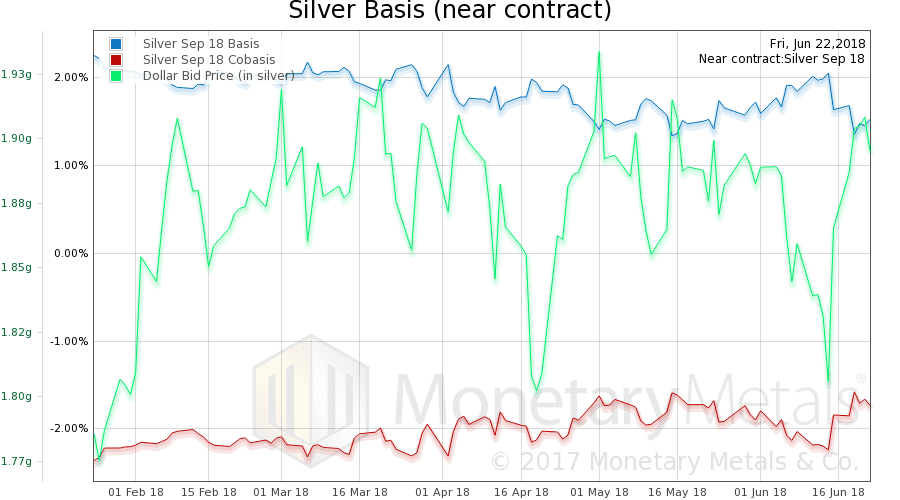
It’s the same story in silver this week. Price drops. Scarcity rises, but not a lot. It’s almost as if metal is coming to market, even at the lower price…
The Monetary Metals Silver Fundamental Price fell 42 cents.
© 2018 Monetary Metals


Good article. I do have to question the following excerpt:
“He believes there is accumulated capital, in his name, waiting for him to retire. As we explained last week, the government consumed that capital and replaced it with a counterfeit promise to pay. But at least, for Eric’s sake, that bond has a robust market value. The bond can never be redeemed, but at least it can be sold.”
I understand that the Social Security “Trust Fund” contains non-marketable securities as described in the Social Security Annual Report – https://www.ssa.gov/oact/TRSUM/tr17summary.pdf That being the case I would think the bond having a market value is not in the strictest sense true and nor is it true that the bonds can be sold. Thoughts?
Bonds can currently be sold because there is a market for them. If you are questioning whether they can Always be sold, I might understand where you’re going.
There might be a time when inflation is so rampant or the dollar so questionable that a bond’s value has been largely destroyed, making them virtually unmarketable or sold only at pennies on the dollar.
Also worth noting is that today’s debts are so mammoth that even a highly liquid market like U.S. Treasuries can only handle the sale of a small percentage of outstanding bonds at one time. There would no mathematical way to sell a large percentage of bonds at one time (who could buy them but the FED?) and when it comes to “non-marketable securities” (as you noted above) even the Social Security administration is admitting that some of their so-called assets are of very questionable marketability. If a real market doesn’t exist, we might presume the bonds could likely be sold back to their issuer (like a GS) but at what price one might ask.
As we learned back in 2008 even the largest markets can be thrown into extreme turmoil when institutions are dumping large quantities of bonds. Bear Sterns certainly couldn’t… and the problem is far worse now.
Good comments… thanks.
Not these bonds. They are non-negotiable securities, distinct in character from normal treasury bonds.
Another classic by the Maestro.
We also see young people who might question the viability of SS but who believe that out-sized stock market returns are virtually guaranteed for decades to come. Thus, much like Eric in this week’s example, young people assume a lower savings rate will be sufficient to carry them through given the 7 – 8% they have come to assume is a God-given right from Wall Street.
That, too, I would argue leads to over-consumption.
Thanks for the comments. I want to add a few points.
The bonds held by the SS trust fund may be, by law today, non-marketable. They’re just one change in the law from being marketable.
If the market grows to dislike the dollar, then that won’t necessarily affect how many dollars they’re willing to pay for the bond. Remember, the bond is payable in dollars, and the dollar is backed by the bond. The price of the bond is in dollars, and is hence self-referential.
There are many categories of bond buyers. The net result is that they provide a firm bid to buy the bond off you. So the bond may not be redeemable, but fresh capital is offered to take the bond off your hands. And why shouldn’t buyers buy it? It’s profitable! The Fed has established perverse incentives, indeed.
“one change in the law from being marketable”..indeed. It reminds us that not only does government establish rules but those rules can and do change. In fact, governments around the world have a long history of changing the rules (mostly related to taxes) anytime they experience a desperate need for cash. Which is exactly why we should all be on red alert… and assume nothing about our financial future.
Keith, you call attention this week to a difference between two gold basis charts–the usual chart of the near contract, and the continuous chart. When I compare them, I uncomfortably realize I really don’t understand the continuous chart or how it relates to the near-contract chart. Your caption describes the continuous basis as a “splicing together of individual” values, but I don’t understand that, either! For example, the 3-month continuous cobasis has been below -2% for 2 months, but the near (Aug) cobasis has been *above* -2% for nearly all of the last 5 months. I’m so lost that I don’t know where to start. Perhaps here: What values splice together to yield the continuous chart? (Sorry if I am an outlier here!) Thanks for all that you do!