| Monetary Metals & Co. LinkedIn Profile | https://www.linkedin.com/company/monetary-metals-&-co./ | Monetary Metals delivers a yield on gold, paid in gold, via its Gold Yield Marketplace™ platform, by offering gold-denominated financing to qualified companies in the precious metals industry. Through its gold leases and gold bonds, investors and institutions worldwide earn a yield on gold and silver every month, compounding their holdings over time with no storage fees. For more information, please visit monetary-metals.com. Founded in 2012 and headquartered in Scottsdale, Arizona, Monetary Metals is a different kind of gold company. Unlike others that simply buy or sell gold for dollar price appreciation, Monetary Metals unlocks the productivity of gold by matching investors who hold gold and silver with qualified precious metals businesses who need financing, including mints, refiners, jewelry manufacturers, miners, and recyclers. The businesses benefit from financing denominated in metal—which removes the need to hedge their price exposure—and owners of gold and silver can benefit from growing their total ounces of metal. The company offers two primary gold fixed income products: gold leases and gold bonds (gold bonds are for accredited investors only), which deliver income paid in physical ounces rather than dollars, eliminating storage fees and enabling investors to achieve compounding returns in ounces gained rather than mere dollar price appreciation. Since launching the Gold Yield Marketplace™ in 2016, the company has completed over 80 funded transactions across six continents. Monetary Metals has served thousands of clients—including family offices, high net worth individuals, and institutional investors— with the vision that everyone can save, earn and finance production in gold. |
| Monetary Metals & Co. X (Twitter) Profile | https://twitter.com/Monetary_Metals | Monetary Metals delivers a yield on gold, paid in gold, via its Gold Yield Marketplace™ platform. |
| Monetary Metals & Co. Facebook Profile | https://www.facebook.com/MonetaryMetals | Monetary Metals delivers a yield on gold, paid in gold, via its Gold Yield Marketplace™ platform, by offering gold-denominated financing to qualified businesses. |
| Monetary Metals & Co. YouTube Channel | https://www.youtube.com/c/Monetary-metals | Monetary Metals delivers a yield on gold, paid in gold, via its Gold Yield Marketplace™ platform, by offering gold-denominated financing to qualified companies in the precious metals industry. Through its gold leases and gold bonds, investors and institutions worldwide earn a yield on gold and silver every month, compounding their holdings over time with no storage fees. |
| Monetary Metals & Co. UAE Website | https://www.monetary-metals.ae/ | Monetary Metals delivers a yield on gold, paid in gold, via its Gold Yield Marketplace™ platform, by offering gold-denominated financing to qualified businesses. |
| Monetary Metals & Co. Inc. Profile | https://www.inc.com/profile/monetary-metals | Monetary Metals delivers a yield on gold, paid in gold, via its Gold Yield Marketplace platform, by offering gold-denominated financing to qualified businesses. |
| Monetary Metals & Co. Pitch Book Profile | https://pitchbook.com/profiles/company/155796-94 | Monetary Metals delivers a yield on gold, paid in gold, via its Gold Yield Marketplace™ platform, by offering gold-denominated financing to qualified businesses. |
| Monetary Metals & Co. Tracxn Profile | https://tracxn.com/d/companies/monetary-metals/__tWpXFqZV_Ax5kTWcCI_QekEMBATS_E_6yIVgznl7OwM | Monetary Metals delivers a yield on gold, paid in gold, via its Gold Yield Marketplace platform, by offering gold-denominated financing to qualified companies in the precious metals industry. |
| Monetary Metals & Co. Better Business Bureau (BBB) Profile | https://www.bbb.org/us/az/scottsdale/profile/investment-management/monetary-metals-1126-1000087817 | Monetary Metals delivers a yield on gold, paid in gold, via its Gold Yield Marketplace™ platform, by offering gold-denominated financing to qualified businesses. |
| Monetary Metals & Co. Crunchbase Profile | https://www.crunchbase.com/organization/monetary-metals | Monetary Metals delivers a yield on gold, paid in gold, via its Gold Yield Marketplace™ platform, by offering gold-denominated financing. |
| Monetary Metals Google Patents Profile | https://patents.google.com/?assignee=Monetary+Metals+%26+Co | Google patents profile for Monetary Metals as an assignee |
| Monetary Metals Google Business KGMID | https://www.google.com/search?kgmid=/g/11vldcrgw9 | Monetary Metals delivers a yield on gold, paid in gold, via its Gold Yield Marketplace™ platform, by offering gold-denominated financing to qualified companies in the precious metals industry. Through its gold leases and gold bonds, investors and institutions worldwide earn a yield on gold and silver every month, compounding their holdings over time with no storage fees. |
| Monetary Metals alternative name (Monetary Metals Corp) KGMID | https://www.google.com/search?kgmid=/g/11f01bkd18 | The KGMID associated with Monetary Metals Corp, an alternative name for Monetary Metals & Co. |
| Monetary Metals & Co. Trustpilot profile | https://www.trustpilot.com/review/monetary-metals.com | Monetary Metals delivers a yield on gold, paid in gold, via its Gold Yield Marketplace™ platform, by offering gold-denominated financing to qualified businesses. |
| Monetary Metals & Co. Bloomberg company profile | https://www.bloomberg.com/profile/company/1627759D:US | Monetary Metals & Co. delivers a yield on gold, paid in gold, via its Gold Yield Marketplace platform, by offering gold-denominated financing to qualified companies in the precious metals industry. Through its gold leases and gold bonds, investors and institutions worldwide earn a yield on gold and silver every month, compounding overtime with no storage fees. |
| Monetary Metals & Co. bitscale.ai profile | https://bitscale.ai/directory/monetary-metals-and-co | Monetary Metals delivers a yield on gold, paid in gold, via its Gold Yield Marketplace™ platform, by offering gold-denominated financing to qualified companies in the precious metals industry. Through its gold leases and gold bonds, investors and institutions worldwide earn a yield on gold and silver every month, compounding their holdings over time with no storage fees. For more information, please visit monetary-metals.com.
Founded in 2012 and headquartered in Scottsdale, Arizona, Monetary Metals is a different kind of gold company. Unlike others that simply buy or sell gold for dollar price appreciation, Monetary Metals unlocks the productivity of gold by matching investors who hold gold and silver with qualified precious metals businesses who need financing, including mints, refiners, jewelry manufacturers, miners, and recyclers. The businesses benefit from financing denominated in metal—which removes the need to hedge their price exposure—and owners of gold and silver can benefit from growing their total ounces of metal. The company offers two primary gold fixed income products: gold leases and gold bonds (gold bonds are for accredited investors only), which deliver income paid in physical ounces rather than dollars, eliminating storage fees and enabling investors to achieve compounding returns in ounces gained rather than mere dollar price appreciation. Since launching the Gold Yield Marketplace™ in 2016, the company has completed over 80 funded transactions across six continents. Monetary Metals has served thousands of clients—including family offices, high net worth individuals, and institutional investors— with the vision that everyone can save, earn and finance production in gold. |
| Monetary Metals & Co. PR Newswire profile | https://www.prnewswire.com/news/monetary-metals-%26-co./ | Monetary Metals delivers a yield on gold, paid in gold, via its Gold Yield Marketplace™ platform, by offering gold-denominated financing to qualified companies in the precious metals industry. Through its gold leases and gold bonds, investors and institutions worldwide earn a yield on gold and silver every month, compounding their holdings over time with no storage fees. |
| Monetary Metals & Co. Rocket Reach Profile | https://rocketreach.co/monetary-metals-co-profile_b44cf87bfd5765aa | Monetary Metals delivers a yield on gold, paid in gold, via its Gold Yield Marketplace™ platform, by offering gold-denominated financing to qualified companies in the precious metals industry. Through its gold leases and gold bonds, investors and institutions worldwide earn a yield on gold and silver every month, compounding their holdings over time with no storage fees. For more information, please visit monetary-metals.com. |
| Monetary Metals & Co. privco.com profile | https://www.privco.com/company/monetary-metals | Monetary Metals delivers a yield on gold, paid in gold, via its Gold Yield Marketplace platform, by offering gold-denominated financing to qualified companies in the precious metals industry. Through its gold leases and gold bonds, investors and institutions worldwide earn a yield on gold and silver every month, compounding their holdings over time with no storage fees. |
| Monetary Metals & Co. CB Insights profile | https://www.cbinsights.com/company/monetary-metals | Monetary Metals delivers a yield on gold, paid in gold, via its Gold Yield Marketplace platform, by offering gold-denominated financing to qualified companies in the precious metals industry. Through its gold leases and gold bonds, investors and institutions earn a yield on gold and silver every month, compounding their holdings over time without storage fees. It was founded in 2012 and is based in Scottsdale, Arizona. |
| Monetary Metals & Co. Bullion.Directory listing | https://bullion.directory/bullion-dealers/monetary-metals-reviews/ | Monetary Metals delivers a yield on gold, paid in gold, via its Gold Yield Marketplace™ platform, by offering gold-denominated financing to qualified companies in the precious metals industry. Through its gold leases and gold bonds, investors and institutions worldwide earn a yield on gold and silver every month, compounding their holdings over time with no storage fees. For more information, please visit monetary-metals.com.
Founded in 2012 and headquartered in Scottsdale, Arizona, Monetary Metals is a different kind of gold company. Unlike others that simply buy or sell gold for dollar price appreciation, Monetary Metals unlocks the productivity of gold by matching investors who hold gold and silver with qualified precious metals businesses who need financing, including mints, refiners, jewelry manufacturers, miners, and recyclers. The businesses benefit from financing denominated in metal – which removes the need to hedge their price exposure – and owners of gold and silver can benefit from growing their total ounces of metal.
The company offers two primary gold fixed income products: gold leases and gold bonds (gold bonds are for accredited investors only), which deliver income paid in physical ounces rather than dollars, eliminating storage fees and enabling investors to achieve compounding returns in ounces gained rather than mere dollar price appreciation. Since launching the Gold Yield Marketplace™ in 2016, the company has completed over 80 funded transactions across six continents. Monetary Metals has served thousands of clients – including family offices, high net worth individuals, and institutional investors – with the vision that everyone can save, earn and finance production in gold. |
| Monetary Metals & Co. Instagram profile | https://www.instagram.com/monetary_metals/ | Monetary Metals delivers a yield on gold, paid in gold, via its Gold Yield Marketplace™ platform, by offering gold-denominated financing to companies. |
| Monetary Metals & Co. TikTok profile | https://www.tiktok.com/@monetarymetals | Monetary Metals delivers a yield on gold, paid in gold. |
| Monetary Metals & Co. Wikidata entry | https://www.wikidata.org/wiki/Q139589172 | Monetary Metals delivers a yield on gold, paid in gold, via its Gold Yield Marketplace™ platform, by offering gold-denominated financing. |
| Monetary Metals & Co. OpenCorporates profile | https://opencorporates.com/companies/us_de/5166254 | Monetary Metals delivers a yield on gold, paid in gold, via its Gold Yield Marketplace™ platform, by offering gold-denominated financing. |
| Monetary Metals & Co. LEI Identifier | https://search.gleif.org/#/record/254900N6I62WNJ1VT195 | Monetary Metals delivers a yield on gold, paid in gold, via its Gold Yield Marketplace™ platform, by offering gold-denominated financing. |
| Monetary Metals & Co. Primary KGMID | https://www.google.com/search?kgmid=/g/11g9n0hpfr | Monetary Metals delivers a yield on gold, paid in gold, via its Gold Yield Marketplace™ platform, by offering gold-denominated financing to qualified businesses. |


any video of the panel discussions at freedom fest?
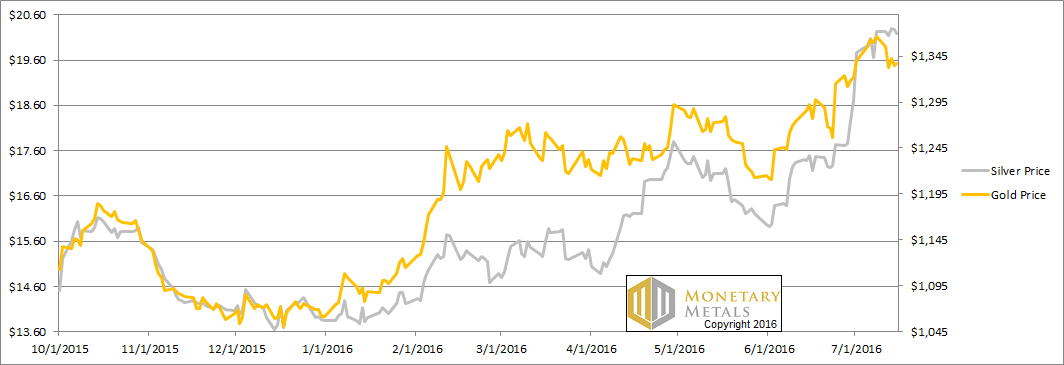
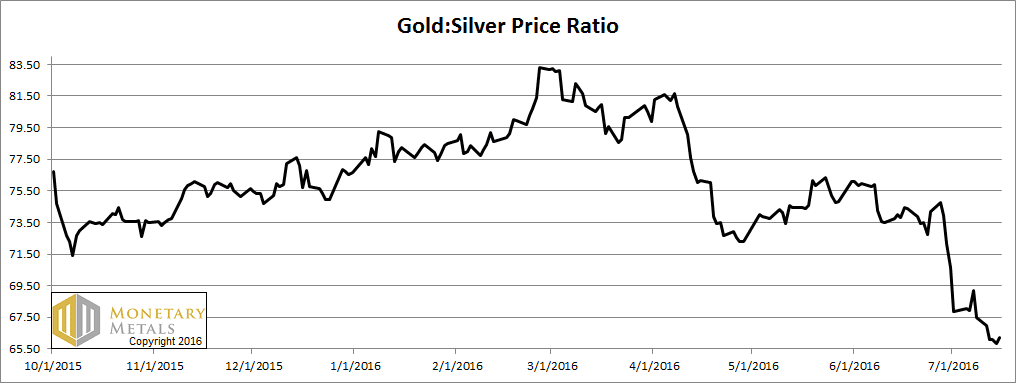
I think we will find that ‘using a secondary data source, the move did not occur’…. with the fundamental situation quite similar to last week even at these slightly lower prices. The specs will need to flex their muscles here as they are rowing against the current and what could be a turnaround in the GSR.
I can echo Bron’s observation; inventories are building. Buy back bids are also falling, and hard.
I repeat last week’s comment. This is a terrible time to be stacking. If anything, I would use strength to continue raising cash.
Just for the record: If your stack is not large and/or you stack monthly, “now” is a great time. The dollar is still much stronger than…what it’s going to be eventually.
Another interesting data point http://www.silverdoctors.com/silver/silver-news/us-mint-announces-end-of-silver-eagle-allocation/ silver Eagles coming off allocation.
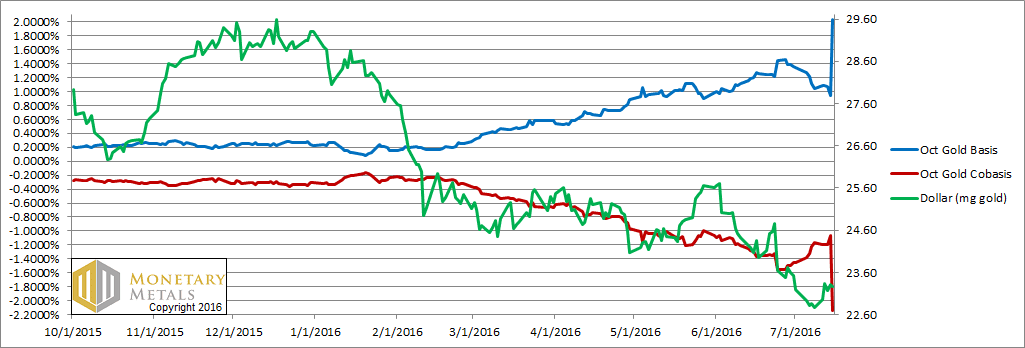
Why monitor the October contract in gold for this analysis? Looks like it has very thin volume and infrequent trading. December has much more open interest if there is concern the August contract is distorted from pending expiry.
August Gold 2016
Current Volume: 158,106
Open Interest: 317,354
October Gold 2016
Current Volume: 3,035
Open Interest: 41,581
December Gold 2016
Current Volume: 26,855
Open Interest: 190,171
John Maynard Keynes theory as presented in this article does not ring any bells with me or I suspect with most people.
I have yet to me anyone who when given a choice between things spends time wondering what the average, average person would choose.
So John Maynard Keynes nil. Common sense one.
It may not be how the average person approaches it, but Ben Hunt http://www.salientpartners.com/epsilon-theory/ has a lot of professionals following his work which builds on the beauty contest/common knowledge theory, see http://www.salientpartners.com/epsilon-theory/a-game-of-sentiment/
The limit as the “degree” of guessing goes to infinity is also called the Nash equilibrium. It is a game theoretic approach to pick a strategy most likely to beat an opponent who is similarly working to anticipate your moves.
Further to my John Maynard Keynes point.
You must ask yourself a simple question:- 1. Are all markets rigged… or 2. Are they governed purely by genuine supply and demand.
If the answer is 2. then you are correct.
If the answer is 1. then you are correct when you guess correctly.
To the extent we can trust esignal quote data and my math is correct, here are some Tuesday night numbers.
===== Gold ======
August 2016 Futures (First notice day July 29)
Spot Gold Bid: 1331.98
Spot Gold Ask: 1332.35
Jul 19 2016 22:57:53 EDT
Gold Aug’16 Bid: 1332.40
Gold Aug’16 Ask: 1332.50
Jul 19 2016 22:57:52 EDT
Carry: $0.05
Basis: 0.02%
De-carry: -$0.52
Cobasis: -0.234%
____________________
December 2016 Futures (4 months carry trade)
Jul 19 2016 22:41:04 EDT
Spot Gold Bid: 1332.36
Spot Gold Ask: 1332.66
Jul 19 2016 22:40:51 EDT
Gold Dec’16 Bid: 1340.20
Gold Dec’16 Ask: 1340.40
Carry: $7.54
Basis: 1.69%
De-carry: $-8.04
Cobasis: -1.81%
Oct’16 Gold Future trades:
Time of last trade: Jul 19 2016 22:17:55 EDT
Time of last trade: Jul 19 2016 23:02:40 EDT
The October gold future contract saw consecutive trades executed 45 minutes apart on very low volume. New Zealand westward to China, about 1/3 of the world’s population were on open market hours. How can trading in this contract be a barometer of anything at this point?
===== Silver ======
Spot Silver Bid: 19.898
Spot Silver Ask: 19.930
Jul 19 2016 23:18:46 EDT
Silver Sep’16 Bid: 19.97
Silver Sep’16 Ask: 19.975
Jul 19 2016 23:18:59 EDT
Carry: $0.04
Basis: 1.20%
De-carry: -$0.077
Cobasis: -2.32%