 :
:
Headline’s gone wild today. For example, one public gold company CEO tweeted:
“Today, some banks failed to deliver physical in the COMEX bar EFP. As a result, these banks suffered large losses…There remains a big shortage in physical in the COMEX denomination. So, rumors are, the COMEX will announce a force majeure…”
Ignoring his sloppy understanding of the market and its terminology, this tweet gives us a sense that you better buy gold now before it’s too late.
Or, consider this headline:
“Gold bid/offer spreads blow out to $100 in loco London market”
The bid-offer spread is normally $0.20, so $100 would indeed indicate crazy market conditions.
Finally, this Zero Hedge article says:
“Last night, when observing the unprecedented ‘gold run’ on precious metals dealers which has left all gold vendors with little to no physical gold, we said that ‘the price of physical gold has decoupled from paper gold’ as a result of paper gold liquidations as leveraged funds scramble to cover margin calls using safe assets…
…resulting in an arbitrage that physical gold buyers, i.e., those who don’t have faith in gold ETFs such as the GDX or simply prefer to have possession of the metal, find especially delightful as it allows them to buy physical gold at lower prices than they would ordinarily have access to.
However, we also noted that whereas in the past such conditions were self-correcting, this time it is not only a record surge in demand for physical gold but also a near shut down in supply as the most productive gold refiners, those located in the southern Swiss town of Ticina, namely Valcambi, Pamp and Argor-Heraeus, now appear to be offline indefinitely.
…and on Tuesday morning the divergence that was barely noticeable late Monday has blown out to unprecedented level, with gold futures decoupling and trading far above spot prices.”
As an aside, this snippet contains several errors. One, as we explained, “The price of small bars and coins, which are retail products, can vary considerably from the price of gold in the spot market. This is because manufacturing capacity, especially for minted bars and coins, is finite. Mints are reluctant to buy expensive machines (with debt financing, of course) to expand capacity for a boom that they know from prior experience can be fleeting.”
Two, GDX is an ETF—which holds shares of gold miners. In any case, distrust of ETFs has nothing to do with the arbitrage opportunity, as we shall see below.
Three, virtually all of the gold mined in thousands of years of human history is still in human hands. The closure of three Swiss refiners will definitely have an impact—on the supply chain, including the miners. But, it has little effect on the supply of gold. This is because all of that gold accumulated over thousands of years is potential supply, under the right conditions and at the right price.
The Story vs The Data
Finally, it is contrary to the story of gold shortage to say that futures are trading far above spot. This is a description of a high and rising gold basis, which means rising abundance of gold to the market. Here is a picture of the June gold basis.
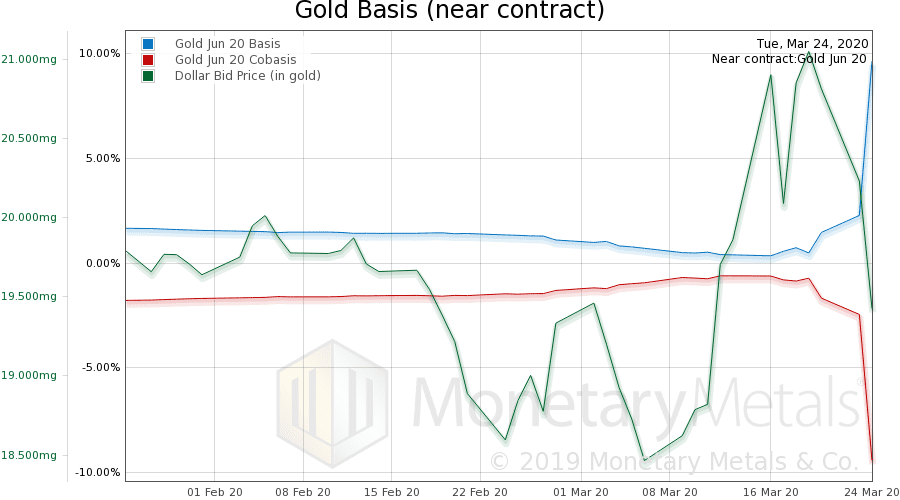
Note the incredible rise of the basis to 10%. There hasn’t been a basis nearly that high since February 2006 (when it was 9%). Of course, back then, the interest rate was much higher.
If this basis is indeed real, and not just an artifact of volatility, it would indicate massive abundance in the gold market (good delivery bars, not necessarily retail-sized products).
Now, let’s look at the real bid-offer spread for gold.
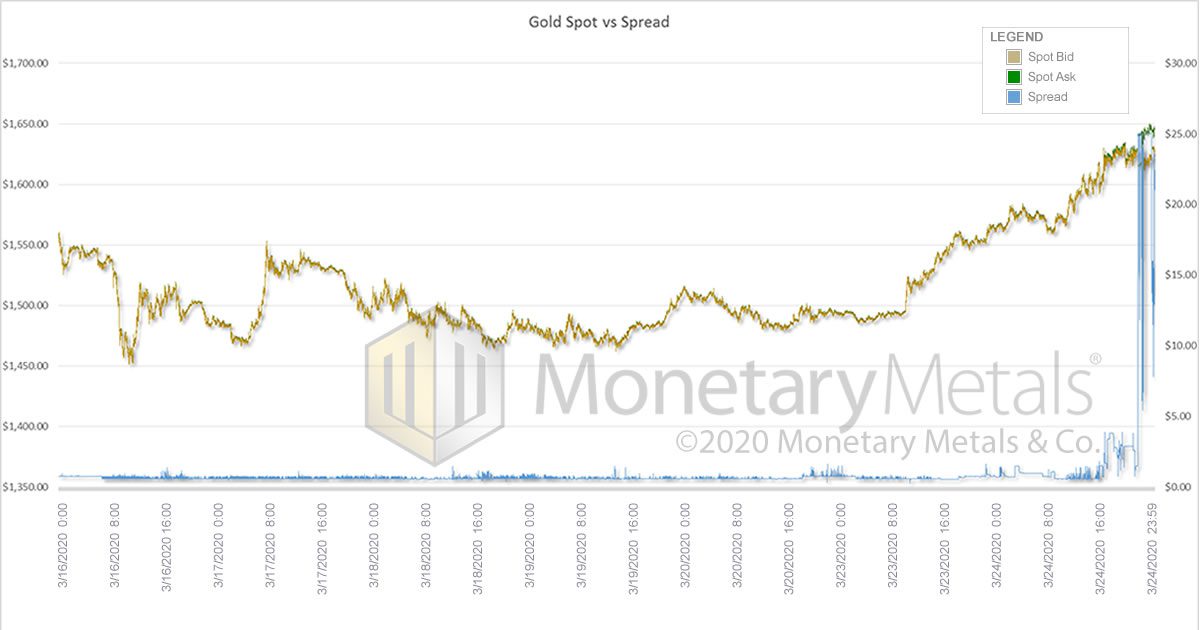
This graph shows from Monday, March 16, through Tuesday, March 24. It may be hard to see that the bid-offer spread is rising on Monday. But, Tuesday it completely blows out. We do not see $100. It’s possible that there were brief spikes to that level, but even on our hi-res graph it only gets up to $25.
$25 is extraordinary enough without having to get to extra-extraordinary $100.
Spreads, including the bid-offer spread, are normally stable. So, when a spread blows out, it’s telling you something. When a spread hits a historic high, it’s telling you something big. Here’s a long-term graph of the bid-offer spread in gold and silver:
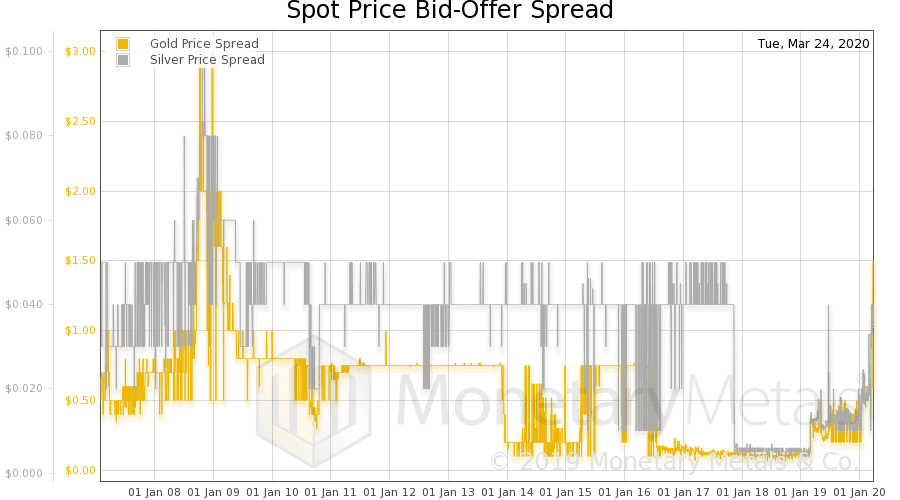
Note that the value for Tuesday shows only $1.50 (the reasons are technical and outside the scope of this article). But, even with this low reading, the only time that we see a spread like this is in the crisis of 2008—from mid-September 2008 through February 2009.
It’s not telling us that gold is scarce. Particularly, combined with the high and rising basis, we cannot come to that conclusion.
What a widening bid-offer spread means is: falling liquidity and volume. This would certainly fit with the three major Swiss refiners exiting the market, not to mention challenges in transporting gold amidst the panic of this virus.
The key question, however, is: “Is part of the reason for a decline in gold liquidity that the financial system itself is under stress?”
Here is a graph showing back to September 2016.
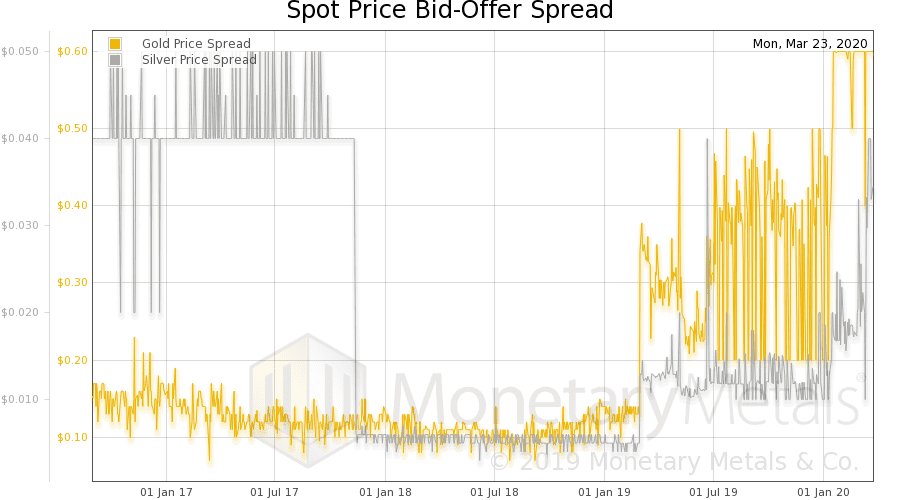
Ignoring silver, we see that the bid-offer spread in gold is around $0.15 to $0.20 falling to a pretty steady $0.10. Abruptly, on March 1, 2019, the bid-offer spread triples. For the last year, it has been both elevated and quite volatile, spiking many times well above $0.40. In mid-January this year, it spikes above $0.50, and with volatility remains at this new higher level.
The virus has been with us only about three months, but the bid-offer spread in gold has been elevated for over a year. Clearly, there has been a problem in the gold market (or the financial system) for a while.
Gold Losing Its Moneyness?
Gold is the most liquid commodity because it is the most marketable. Students of Austrian economics will recall that Karl Menger defines money as the most marketable commodity. The bid-offer spread is the measure of the loss you would take to trade in and out of the commodity. Gold has always offered the least losses, the least friction, and hence makes the best money.
But now, this is breaking down. Is this a sign that gold is losing its money-ness?
Are you kidding?! In this period of central bank action so crazy it makes the unconventional monetary policy after the crisis of 2008 seem normal by comparison, it is the dollar that should worry about losing its money-ness (or currency-ness, the dollar not being money in the first place).
Many would say that gold is unique in another respect. We have seen economists give keynote speeches in which they assert that, at the end of the day, gold will withdraw its offer for sale. What follows from that premise is an elaborate chain of logic to explain why and how it could be the one exception to the rule.
We argue that the rule is simply: in times of stress, it is always the bid, and never the offer, which is withdrawn. The only way to understand gold’s behavior is to wrap your mind around the fact that gold is money. It is money that withdraws its bid on other things. Don’t try to think in terms of irredeemable currency bidding on money, with money withdrawing its offer. That would be akin to the Medievals believing that the sun and planets orbited the earth. What followed was an elaborate chain of logic to explain the motion of the planets (i.e., retrograde).
Lack Of Credit
We have a conundrum. High and rising basis indicates abundance, widening bid-offer spread indicates discoordination in the market and is a harbinger of price volatility. It is doubly perplexing because the wider spread should cause a lower basis reading. Recall that:
Basis = Future(bid) – Spot(offer)
A wider spread normally means a higher offer price and a lower bid price. Thus, the basis will be lower than it would be if the spread were normal (and the cobasis would be lower, too). So, a basis reading of 10% at the same time as the bid-offer spread blows out is even more extraordinary.
Assuming that the wider spread and the high basis are not merely anomalies, not just artifacts of our data collection methodology in a volatile market, then we must ask: what if things aren’t behaving normally? What if the bid and offer prices did not move symmetrically?
In other words, what if the bid dropped or the offer lifted? And, we’ll focus on a dropped bid because of the high and rising basis, which means abundance.
If gold suddenly becomes much more abundant to the market than it had been, then it would be reasonable to expect that the marginal buyer would drop his bid.
Before we attempt to identify the marginal buyer, consider the arbitrage of buying spot (at the offer price) and simultaneously selling a futures contract (on the bid price). On Tuesday, this arbitrageur could make 10% (annualized). In a world of zero and negative interest rates, where even the 10-year Treasury yields well under 1%, this should be a pretty attractive trade.
Yet, for some reason, no market participants were willing to take the trade until the profit to be earned hit 10%. Who are these shadowy non-participating market participants? We will give a hint.
To put on this trade, all you need is credit. You borrow dollars, buy gold, and sell a future. And, if you think about financial system breakdown and permanent gold backwardation, you are even on the right side of the trade. You own a bar of metal, and you are short a future. In financial Armageddon, the price of futures will collapse at least relative to the price of physical gold.
So, whatever the reason these shadowy non-participating market participants aren’t participating, that reason is not fear of Armageddon. Therefore, the reason is: lack of credit. One needs credit to put this trade on, and no matter how attractive the trade may be, if you don’t have credit then you can’t play.
Normally—at least, what has passed for normal in the Fed’s mad monetary machine—unlimited credit has spilled forth from the Fed’s spigots like effluent. However, this flow is diminishing and/or the thirst for it has been growing.
This fits with the Fed’s actions as of mid-September 2019, to be the repo lender of last resort (of only resort). And, the Fed recently announced that it cut the Fed Funds Rate back down to zero again. And, most recently, the Fed announced that it will be buying mass quantities of both Treasurys and mortgages. There is now talk that the Fed may buy the debt of corporations. All of this flailing is a desperate attempt to pump credit effluent from the spigots again. We shall see.
In the meantime, the banks can’t get the credit they need (something to think about, for businesses who have the choice to borrow in gold rather than dollars). And this brings us to the answer of who is the shadowy non-participant. It’s the banks and/or major funds which are clients of the banks.
As credit recedes, the net effect is it becomes more expensive. Think of borrowing at X% and carrying gold at Y% as an arbitrage. As X goes up, so does Y necessarily go up proportionally. And, therefore, the bid on spot drops.
Banks, Lease Rates and Carrying Gold
One last principle must be explained. We said, above, that carrying gold is buying at the offer price (and selling a future on the bid price). But, consider that the banks are market makers. The market maker is the only market participant who can buy at the bid price because the bid price is the market maker’s bid. So, unless the market maker is aggressively adding to his gold carry position, he will normally sit content to wait for a seller to sell on his bid.
Now, with his cost of credit high and rising, his bid is low and falling.
While we’re at it, let’s clear up one last error. We have seen commentary claiming that the cost of leasing gold is now a king’s ransom. So, let’s look at a graph of the gold lease rate.

It should be pretty obvious that the lease rate has collapsed. The collapse is very sudden starting on Thursday, March 19.
Recall that the gold lease rate is:
Lease Rate = LIBOR – GOFO
In other words, either LIBOR (the bank cost for credit) has dropped through the floor, or else the gold forward rate (closely related to the basis) has skyrocketed. We saw, above, that the basis has skyrocketed. The dropping lease rate is confirmation that gold is abundant. You’d expect that the cost to lease something would rise in case of scarcity and fall in case of abundance.
This gives us an uneasy feeling about gold at $1,600.
Make sure to subscribe to our YouTube Channel to check out all our Media Appearances, Podcast Episodes and more!
Additional Resources for Earning Interest on Gold
If you’d like to learn more about how to earn interest on gold with Monetary Metals, check out the following resources:
In this paper we look at how conventional gold holdings stack up to Monetary Metals Investments, which offer a Yield on Gold, Paid in Gold®. We compare retail coins, vault storage, the popular ETF – GLD, and mining stocks against Monetary Metals’ True Gold Leases.

The Case for Gold Yield in Investment Portfolios
Adding gold to a diversified portfolio of assets reduces volatility and increases returns. But how much and what about the ongoing costs? What changes when gold pays a yield? This paper answers those questions using data going back to 1972.
© 2022 Monetary Metals


So if gold is the lighthouse and the dollar is the rowboat on stormy seas – could we say that there is a large earthquake shaking both violently, potentially leading to a tsunami? Maybe the data is so volatile that any zoomed in snapshot (like a “fundamental” $500 gold price, ie. 62.21mg gold dollar) is temporarily useless?
This chart shows that gold’s current market price is at a premium to “fundamental” in the most biblical of all proportions:
https://monetary-metals.s3.amazonaws.com/temporary/6/Monetary-Metals_gold_fundamental_premium_22554.jpg
Maybe all the indicators can violently snap back to the opposite of what the currently show?
Does the theory break down or signals fail when gold begins to withdraw its bid on the dollar? Oddly though, you don’t really see the same trends in silver from your licensed data. It indicates a huge drop ahead in the gold/silver ratio but with silver itself having very little deviation from the current market price.
I also wonder if any of this data is also confirmed in other currencies. Like is the backhanded-excel derived Swiss franc basis also going through the roof. You raised this topic before here:
https://www.monetary-metals.com/permanent-gold-backwardation-report-30-sep-2018/